| Full name: SUMO1 activating enzyme subunit 1 | Alias Symbol: AOS1|FLJ3091|Sua1 | ||
| Type: protein-coding gene | Cytoband: 19q13.32 | ||
| Entrez ID: 10055 | HGNC ID: HGNC:30660 | Ensembl Gene: ENSG00000142230 | OMIM ID: 613294 |
Screen Evidence:
| |||
Expression of SAE1:
| Dataset | Gene | EntrezID | Probe | Log2FC | Adj.pValue | Expression |
|---|---|---|---|---|---|---|
| GSE17351 | SAE1 | 10055 | 217946_s_at | 0.1259 | 0.7387 | |
| GSE20347 | SAE1 | 10055 | 217946_s_at | 0.3309 | 0.0154 | |
| GSE23400 | SAE1 | 10055 | 217946_s_at | 0.3472 | 0.0000 | |
| GSE26886 | SAE1 | 10055 | 217946_s_at | -0.1157 | 0.6533 | |
| GSE29001 | SAE1 | 10055 | 217946_s_at | 0.3888 | 0.0390 | |
| GSE38129 | SAE1 | 10055 | 217946_s_at | 0.3250 | 0.0098 | |
| GSE45670 | SAE1 | 10055 | 217946_s_at | 0.2187 | 0.1683 | |
| GSE53622 | SAE1 | 10055 | 111299 | 0.1068 | 0.1329 | |
| GSE53624 | SAE1 | 10055 | 111299 | 0.4676 | 0.0000 | |
| GSE63941 | SAE1 | 10055 | 217946_s_at | 0.1850 | 0.6422 | |
| GSE77861 | SAE1 | 10055 | 217946_s_at | 0.3156 | 0.1824 | |
| GSE97050 | SAE1 | 10055 | A_24_P194000 | -0.3955 | 0.1965 | |
| SRP007169 | SAE1 | 10055 | RNAseq | 0.0634 | 0.8459 | |
| SRP008496 | SAE1 | 10055 | RNAseq | -0.0026 | 0.9908 | |
| SRP064894 | SAE1 | 10055 | RNAseq | 0.4121 | 0.0234 | |
| SRP133303 | SAE1 | 10055 | RNAseq | 0.6543 | 0.0037 | |
| SRP159526 | SAE1 | 10055 | RNAseq | 0.6429 | 0.0035 | |
| SRP193095 | SAE1 | 10055 | RNAseq | 0.3896 | 0.0001 | |
| SRP219564 | SAE1 | 10055 | RNAseq | -0.1794 | 0.7213 | |
| TCGA | SAE1 | 10055 | RNAseq | 0.1305 | 0.0065 |
Upregulated datasets: 0; Downregulated datasets: 0.
Survival by SAE1 expression:
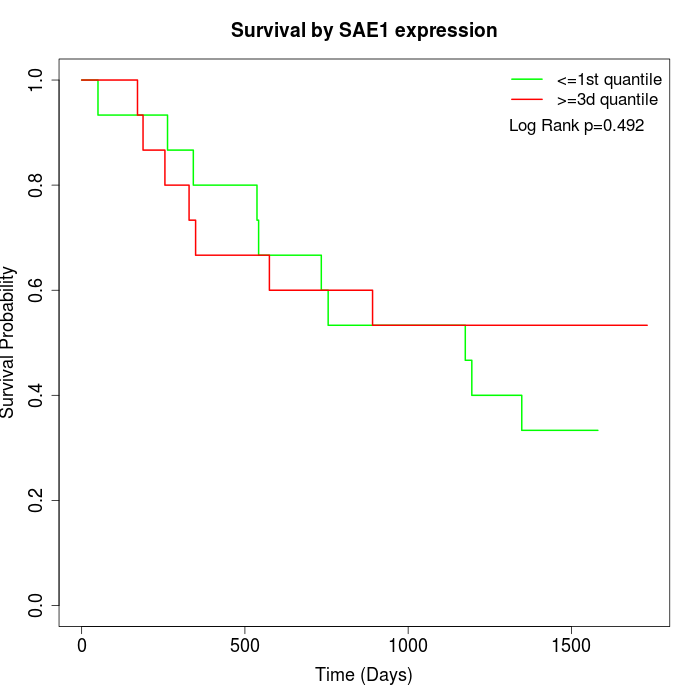 | 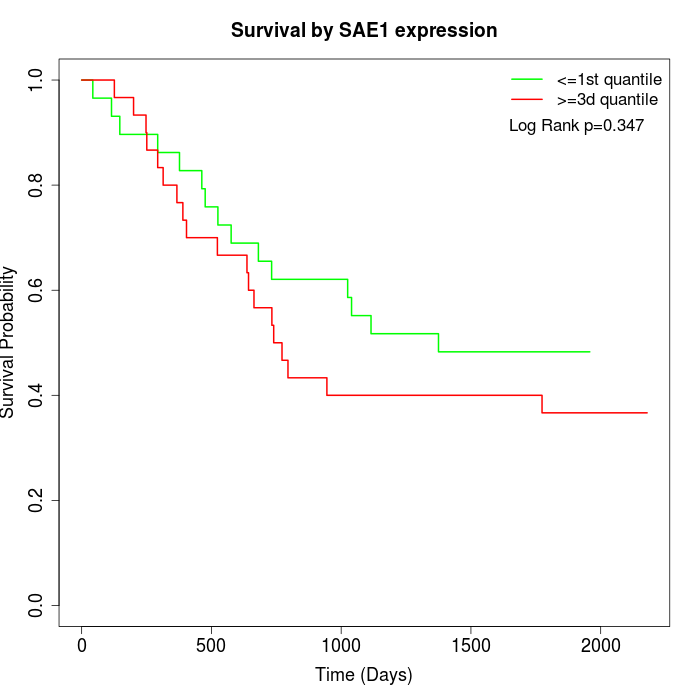 | 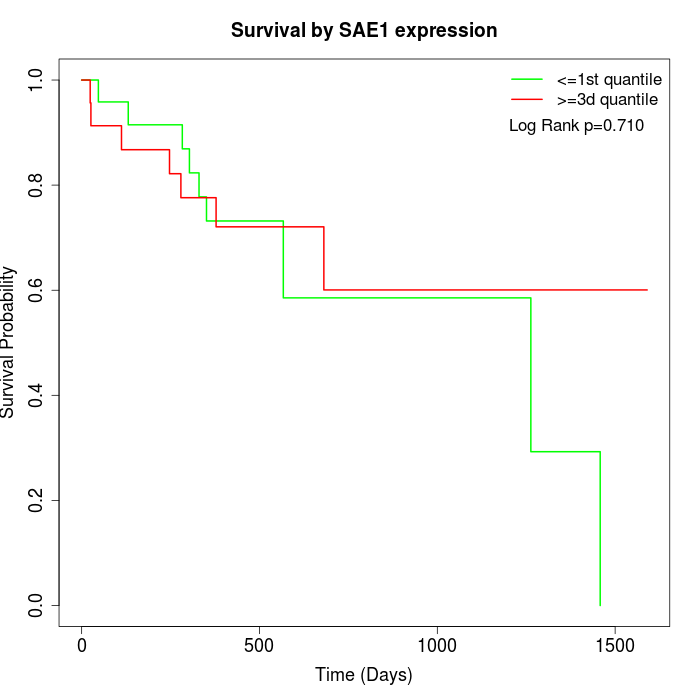 |
| GSE53622 | GSE53624 | TCGA |
Note: Click image to view full size file.
Copy number change of SAE1:
| Dataset | Gene | EntrezID | Gain | Loss | Normal | Detail |
|---|---|---|---|---|---|---|
| GSE15526 | SAE1 | 10055 | 4 | 4 | 22 | |
| GSE20123 | SAE1 | 10055 | 4 | 3 | 23 | |
| GSE43470 | SAE1 | 10055 | 3 | 11 | 29 | |
| GSE46452 | SAE1 | 10055 | 45 | 1 | 13 | |
| GSE47630 | SAE1 | 10055 | 8 | 7 | 25 | |
| GSE54993 | SAE1 | 10055 | 17 | 4 | 49 | |
| GSE54994 | SAE1 | 10055 | 4 | 14 | 35 | |
| GSE60625 | SAE1 | 10055 | 9 | 0 | 2 | |
| GSE74703 | SAE1 | 10055 | 3 | 7 | 26 | |
| GSE74704 | SAE1 | 10055 | 4 | 1 | 15 | |
| TCGA | SAE1 | 10055 | 15 | 18 | 63 |
Total number of gains: 116; Total number of losses: 70; Total Number of normals: 302.
Somatic mutations of SAE1:
Generating mutation plots.
Highly correlated genes for SAE1:
Showing top 20/866 corelated genes with mean PCC>0.5.
| Gene1 | Gene2 | Mean PCC | Num. Datasets | Num. PCC<0 | Num. PCC>0.5 |
|---|---|---|---|---|---|
| SAE1 | ZNF627 | 0.825836 | 3 | 0 | 3 |
| SAE1 | PPP1CC | 0.788183 | 3 | 0 | 3 |
| SAE1 | SAMM50 | 0.776232 | 3 | 0 | 3 |
| SAE1 | CRNKL1 | 0.773734 | 3 | 0 | 3 |
| SAE1 | ZNF322 | 0.770329 | 3 | 0 | 3 |
| SAE1 | CD99L2 | 0.763526 | 3 | 0 | 3 |
| SAE1 | COPA | 0.762494 | 3 | 0 | 3 |
| SAE1 | TXNDC16 | 0.762269 | 3 | 0 | 3 |
| SAE1 | EFCAB7 | 0.755879 | 3 | 0 | 3 |
| SAE1 | CREBBP | 0.732258 | 3 | 0 | 3 |
| SAE1 | INO80E | 0.73132 | 3 | 0 | 3 |
| SAE1 | ASH2L | 0.721636 | 4 | 0 | 4 |
| SAE1 | API5 | 0.718756 | 3 | 0 | 3 |
| SAE1 | CTXN1 | 0.713128 | 3 | 0 | 3 |
| SAE1 | SPNS1 | 0.703708 | 3 | 0 | 3 |
| SAE1 | FBXL14 | 0.703118 | 3 | 0 | 3 |
| SAE1 | LRRC41 | 0.700857 | 4 | 0 | 3 |
| SAE1 | EIF3G | 0.694592 | 6 | 0 | 5 |
| SAE1 | FHOD3 | 0.693413 | 3 | 0 | 3 |
| SAE1 | DUS3L | 0.692458 | 3 | 0 | 3 |
For details and further investigation, click here