| Full name: SAMM50 sorting and assembly machinery component | Alias Symbol: CGI-51|TRG-3|YNL026W|OMP85|TOB55|SAM50 | ||
| Type: protein-coding gene | Cytoband: 22q13.31 | ||
| Entrez ID: 25813 | HGNC ID: HGNC:24276 | Ensembl Gene: ENSG00000100347 | OMIM ID: 612058 |
Screen Evidence:
| |||
Expression of SAMM50:
| Dataset | Gene | EntrezID | Probe | Log2FC | Adj.pValue | Expression |
|---|---|---|---|---|---|---|
| GSE17351 | SAMM50 | 25813 | 201570_at | 0.1209 | 0.6858 | |
| GSE20347 | SAMM50 | 25813 | 201570_at | -0.1717 | 0.4138 | |
| GSE23400 | SAMM50 | 25813 | 201570_at | 0.0753 | 0.2051 | |
| GSE26886 | SAMM50 | 25813 | 201570_at | -0.6738 | 0.0112 | |
| GSE29001 | SAMM50 | 25813 | 201569_s_at | 0.2135 | 0.6039 | |
| GSE38129 | SAMM50 | 25813 | 201570_at | -0.0999 | 0.4886 | |
| GSE45670 | SAMM50 | 25813 | 201569_s_at | 0.0837 | 0.6715 | |
| GSE53622 | SAMM50 | 25813 | 138132 | 0.2694 | 0.0000 | |
| GSE53624 | SAMM50 | 25813 | 138132 | 0.3792 | 0.0000 | |
| GSE63941 | SAMM50 | 25813 | 201570_at | -0.1348 | 0.8230 | |
| GSE77861 | SAMM50 | 25813 | 201570_at | 0.2130 | 0.5041 | |
| GSE97050 | SAMM50 | 25813 | A_23_P29318 | 0.1629 | 0.4089 | |
| SRP007169 | SAMM50 | 25813 | RNAseq | 0.0846 | 0.7983 | |
| SRP008496 | SAMM50 | 25813 | RNAseq | -0.0601 | 0.7503 | |
| SRP064894 | SAMM50 | 25813 | RNAseq | 0.4047 | 0.0358 | |
| SRP133303 | SAMM50 | 25813 | RNAseq | -0.0433 | 0.7146 | |
| SRP159526 | SAMM50 | 25813 | RNAseq | 0.2387 | 0.2974 | |
| SRP193095 | SAMM50 | 25813 | RNAseq | -0.2091 | 0.0333 | |
| SRP219564 | SAMM50 | 25813 | RNAseq | 0.1492 | 0.6099 | |
| TCGA | SAMM50 | 25813 | RNAseq | -0.1044 | 0.0295 |
Upregulated datasets: 0; Downregulated datasets: 0.
Survival by SAMM50 expression:
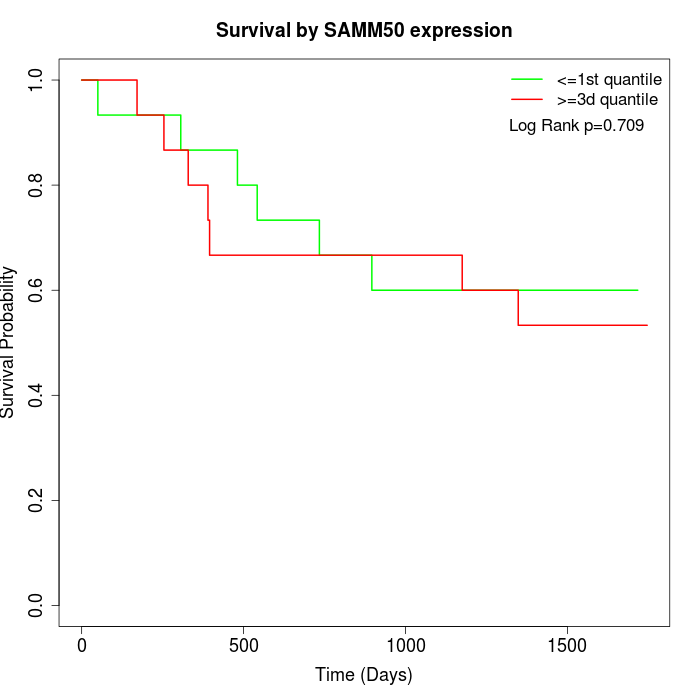 | 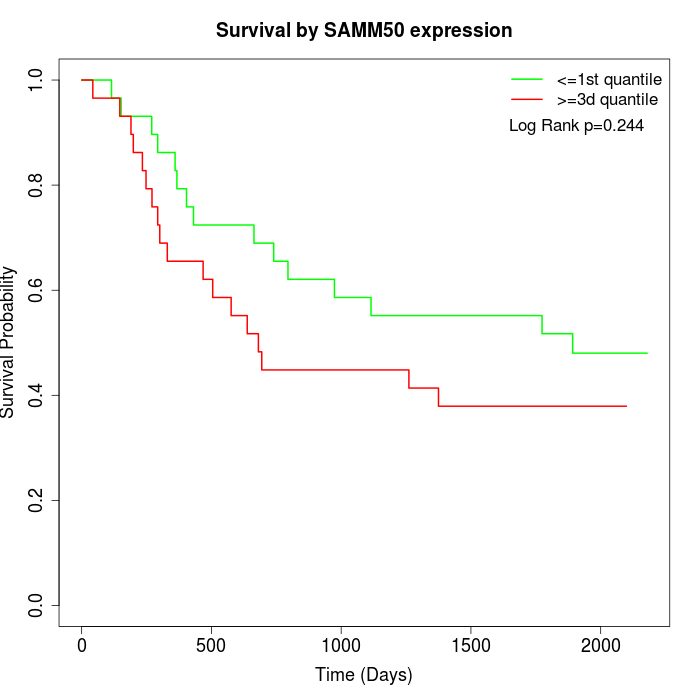 | 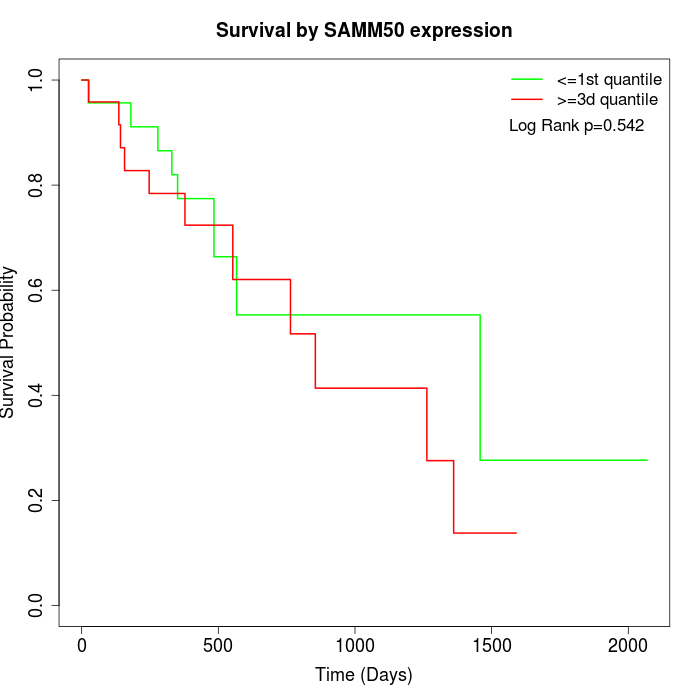 |
| GSE53622 | GSE53624 | TCGA |
Note: Click image to view full size file.
Copy number change of SAMM50:
| Dataset | Gene | EntrezID | Gain | Loss | Normal | Detail |
|---|---|---|---|---|---|---|
| GSE15526 | SAMM50 | 25813 | 5 | 7 | 18 | |
| GSE20123 | SAMM50 | 25813 | 4 | 6 | 20 | |
| GSE43470 | SAMM50 | 25813 | 3 | 6 | 34 | |
| GSE46452 | SAMM50 | 25813 | 31 | 2 | 26 | |
| GSE47630 | SAMM50 | 25813 | 9 | 4 | 27 | |
| GSE54993 | SAMM50 | 25813 | 3 | 6 | 61 | |
| GSE54994 | SAMM50 | 25813 | 11 | 8 | 34 | |
| GSE60625 | SAMM50 | 25813 | 5 | 0 | 6 | |
| GSE74703 | SAMM50 | 25813 | 3 | 4 | 29 | |
| GSE74704 | SAMM50 | 25813 | 2 | 3 | 15 | |
| TCGA | SAMM50 | 25813 | 26 | 15 | 55 |
Total number of gains: 102; Total number of losses: 61; Total Number of normals: 325.
Somatic mutations of SAMM50:
Generating mutation plots.
Highly correlated genes for SAMM50:
Showing top 20/680 corelated genes with mean PCC>0.5.
| Gene1 | Gene2 | Mean PCC | Num. Datasets | Num. PCC<0 | Num. PCC>0.5 |
|---|---|---|---|---|---|
| SAMM50 | SAP30L | 0.807396 | 3 | 0 | 3 |
| SAMM50 | TSPAN9 | 0.806479 | 3 | 0 | 3 |
| SAMM50 | ARFGEF2 | 0.776249 | 3 | 0 | 3 |
| SAMM50 | SAE1 | 0.776232 | 3 | 0 | 3 |
| SAMM50 | RGS18 | 0.772823 | 3 | 0 | 3 |
| SAMM50 | PCMTD2 | 0.771807 | 3 | 0 | 3 |
| SAMM50 | DDX50 | 0.767754 | 3 | 0 | 3 |
| SAMM50 | DHX38 | 0.765441 | 3 | 0 | 3 |
| SAMM50 | MCCC2 | 0.764752 | 3 | 0 | 3 |
| SAMM50 | PHKB | 0.763273 | 3 | 0 | 3 |
| SAMM50 | SH2B3 | 0.758727 | 3 | 0 | 3 |
| SAMM50 | PDPR | 0.753753 | 3 | 0 | 3 |
| SAMM50 | HAUS6 | 0.752938 | 4 | 0 | 3 |
| SAMM50 | PPIP5K2 | 0.752189 | 3 | 0 | 3 |
| SAMM50 | ZNF607 | 0.751181 | 3 | 0 | 3 |
| SAMM50 | PATL1 | 0.749235 | 3 | 0 | 3 |
| SAMM50 | RCN2 | 0.744472 | 3 | 0 | 3 |
| SAMM50 | AXL | 0.734909 | 3 | 0 | 3 |
| SAMM50 | CDC123 | 0.732231 | 6 | 0 | 6 |
| SAMM50 | USP38 | 0.731031 | 3 | 0 | 3 |
For details and further investigation, click here