| Full name: scavenger receptor class A member 5 | Alias Symbol: FLJ23907|MGC45780|NET33 | ||
| Type: protein-coding gene | Cytoband: 8p21.1 | ||
| Entrez ID: 286133 | HGNC ID: HGNC:28701 | Ensembl Gene: ENSG00000168079 | OMIM ID: 611306 |
Expression of SCARA5:
| Dataset | Gene | EntrezID | Probe | Log2FC | Adj.pValue | Expression |
|---|---|---|---|---|---|---|
| GSE17351 | SCARA5 | 286133 | 235849_at | -2.2743 | 0.0757 | |
| GSE26886 | SCARA5 | 286133 | 235849_at | -0.2671 | 0.3296 | |
| GSE45670 | SCARA5 | 286133 | 235849_at | -2.8992 | 0.0000 | |
| GSE53622 | SCARA5 | 286133 | 65729 | -0.4100 | 0.0000 | |
| GSE53624 | SCARA5 | 286133 | 65729 | -0.6497 | 0.0000 | |
| GSE63941 | SCARA5 | 286133 | 235849_at | 0.0983 | 0.5581 | |
| GSE77861 | SCARA5 | 286133 | 235849_at | 0.0193 | 0.8617 | |
| GSE97050 | SCARA5 | 286133 | A_33_P3366241 | -0.1027 | 0.6286 | |
| SRP064894 | SCARA5 | 286133 | RNAseq | -1.6393 | 0.0023 | |
| SRP133303 | SCARA5 | 286133 | RNAseq | -2.8970 | 0.0000 | |
| SRP159526 | SCARA5 | 286133 | RNAseq | -2.5226 | 0.0038 | |
| SRP219564 | SCARA5 | 286133 | RNAseq | 0.0843 | 0.9333 | |
| TCGA | SCARA5 | 286133 | RNAseq | -2.1454 | 0.0000 |
Upregulated datasets: 0; Downregulated datasets: 5.
Survival by SCARA5 expression:
 | 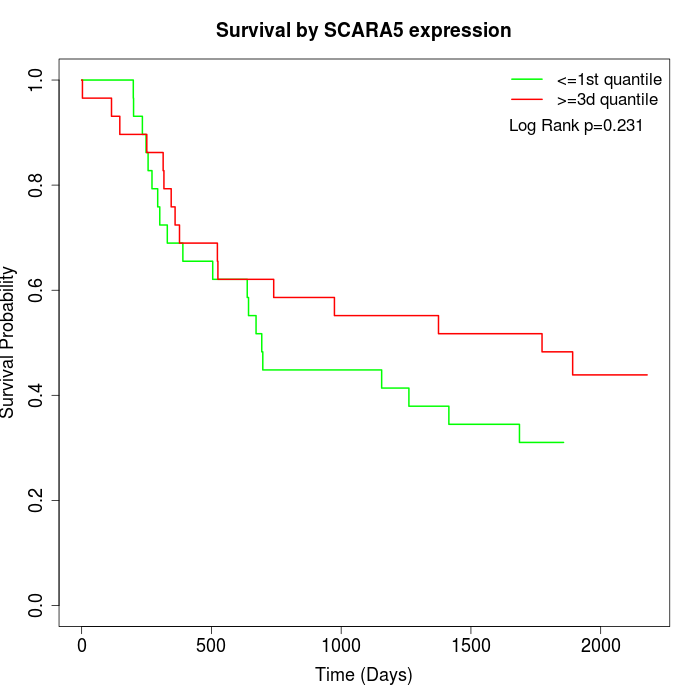 | 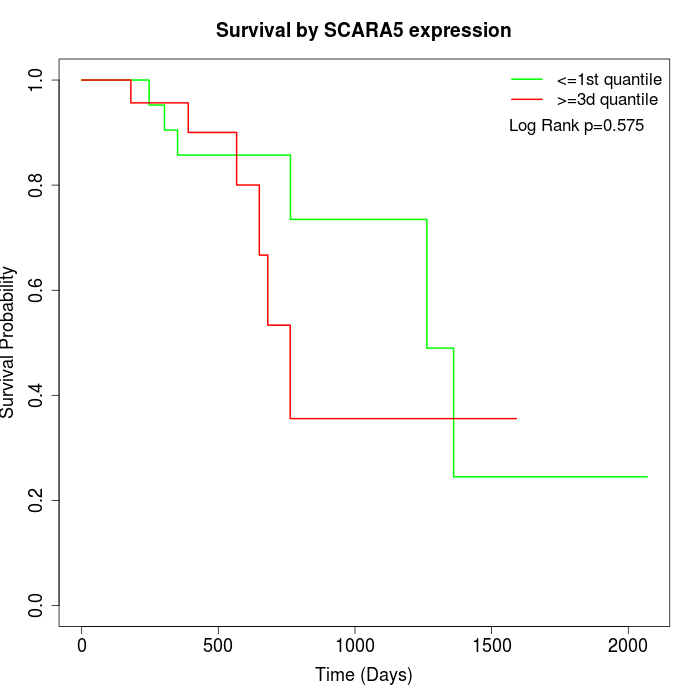 |
| GSE53622 | GSE53624 | TCGA |
Note: Click image to view full size file.
Copy number change of SCARA5:
| Dataset | Gene | EntrezID | Gain | Loss | Normal | Detail |
|---|---|---|---|---|---|---|
| GSE15526 | SCARA5 | 286133 | 5 | 10 | 15 | |
| GSE20123 | SCARA5 | 286133 | 5 | 10 | 15 | |
| GSE43470 | SCARA5 | 286133 | 4 | 7 | 32 | |
| GSE46452 | SCARA5 | 286133 | 13 | 13 | 33 | |
| GSE47630 | SCARA5 | 286133 | 10 | 8 | 22 | |
| GSE54993 | SCARA5 | 286133 | 2 | 15 | 53 | |
| GSE54994 | SCARA5 | 286133 | 10 | 15 | 28 | |
| GSE60625 | SCARA5 | 286133 | 3 | 0 | 8 | |
| GSE74703 | SCARA5 | 286133 | 4 | 6 | 26 | |
| GSE74704 | SCARA5 | 286133 | 4 | 7 | 9 | |
| TCGA | SCARA5 | 286133 | 17 | 42 | 37 |
Total number of gains: 77; Total number of losses: 133; Total Number of normals: 278.
Somatic mutations of SCARA5:
Generating mutation plots.
Highly correlated genes for SCARA5:
Showing top 20/228 corelated genes with mean PCC>0.5.
| Gene1 | Gene2 | Mean PCC | Num. Datasets | Num. PCC<0 | Num. PCC>0.5 |
|---|---|---|---|---|---|
| SCARA5 | FAM110B | 0.844112 | 3 | 0 | 3 |
| SCARA5 | GDF7 | 0.842958 | 3 | 0 | 3 |
| SCARA5 | ENTPD8 | 0.835961 | 3 | 0 | 3 |
| SCARA5 | GPR146 | 0.833845 | 3 | 0 | 3 |
| SCARA5 | ZNF524 | 0.830908 | 3 | 0 | 3 |
| SCARA5 | PHF21B | 0.825705 | 3 | 0 | 3 |
| SCARA5 | TERT | 0.824794 | 3 | 0 | 3 |
| SCARA5 | MFSD6L | 0.817015 | 3 | 0 | 3 |
| SCARA5 | PAX2 | 0.816735 | 3 | 0 | 3 |
| SCARA5 | FGF14 | 0.804515 | 3 | 0 | 3 |
| SCARA5 | CLDN24 | 0.799949 | 3 | 0 | 3 |
| SCARA5 | FOXA3 | 0.793702 | 3 | 0 | 3 |
| SCARA5 | KRTAP6-1 | 0.792058 | 3 | 0 | 3 |
| SCARA5 | PRDM16 | 0.784896 | 3 | 0 | 3 |
| SCARA5 | TDGF1 | 0.782263 | 3 | 0 | 3 |
| SCARA5 | PRSS38 | 0.778618 | 3 | 0 | 3 |
| SCARA5 | OR13G1 | 0.77722 | 3 | 0 | 3 |
| SCARA5 | PRG3 | 0.776 | 4 | 0 | 4 |
| SCARA5 | ESPNL | 0.770881 | 3 | 0 | 3 |
| SCARA5 | ZC3H6 | 0.769769 | 3 | 0 | 3 |
For details and further investigation, click here