| Full name: SET binding protein 1 | Alias Symbol: SEB|KIAA0437 | ||
| Type: protein-coding gene | Cytoband: 18q12.3 | ||
| Entrez ID: 26040 | HGNC ID: HGNC:15573 | Ensembl Gene: ENSG00000152217 | OMIM ID: 611060 |
Screen Evidence:
| |||
Expression of SETBP1:
| Dataset | Gene | EntrezID | Probe | Log2FC | Adj.pValue | Expression |
|---|---|---|---|---|---|---|
| GSE17351 | SETBP1 | 26040 | 227478_at | -1.0332 | 0.1110 | |
| GSE20347 | SETBP1 | 26040 | 205933_at | 0.0435 | 0.8696 | |
| GSE23400 | SETBP1 | 26040 | 205933_at | -0.1951 | 0.0709 | |
| GSE26886 | SETBP1 | 26040 | 227478_at | 0.1390 | 0.8601 | |
| GSE29001 | SETBP1 | 26040 | 205933_at | -0.1794 | 0.5853 | |
| GSE38129 | SETBP1 | 26040 | 205933_at | -0.4884 | 0.0636 | |
| GSE45670 | SETBP1 | 26040 | 227478_at | -1.3489 | 0.0003 | |
| GSE53622 | SETBP1 | 26040 | 42430 | -0.5670 | 0.0000 | |
| GSE53624 | SETBP1 | 26040 | 42430 | -0.5902 | 0.0000 | |
| GSE63941 | SETBP1 | 26040 | 227478_at | -1.0669 | 0.3225 | |
| GSE77861 | SETBP1 | 26040 | 205933_at | 0.7084 | 0.1390 | |
| GSE97050 | SETBP1 | 26040 | A_23_P4551 | -0.3324 | 0.2861 | |
| SRP007169 | SETBP1 | 26040 | RNAseq | -0.6604 | 0.3195 | |
| SRP064894 | SETBP1 | 26040 | RNAseq | -0.2022 | 0.5376 | |
| SRP133303 | SETBP1 | 26040 | RNAseq | -0.5763 | 0.0202 | |
| SRP159526 | SETBP1 | 26040 | RNAseq | 0.0578 | 0.8623 | |
| SRP193095 | SETBP1 | 26040 | RNAseq | 0.3151 | 0.1676 | |
| SRP219564 | SETBP1 | 26040 | RNAseq | 0.1418 | 0.8517 | |
| TCGA | SETBP1 | 26040 | RNAseq | -0.3205 | 0.0019 |
Upregulated datasets: 0; Downregulated datasets: 1.
Survival by SETBP1 expression:
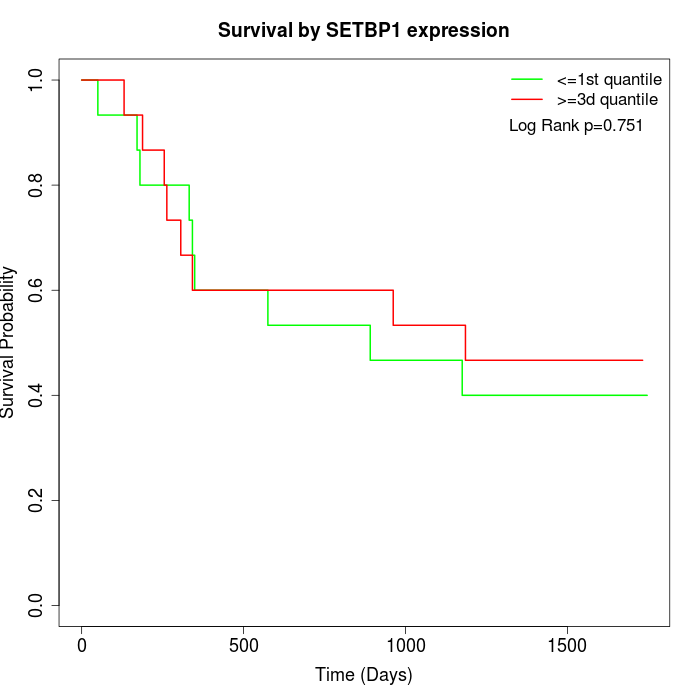 | 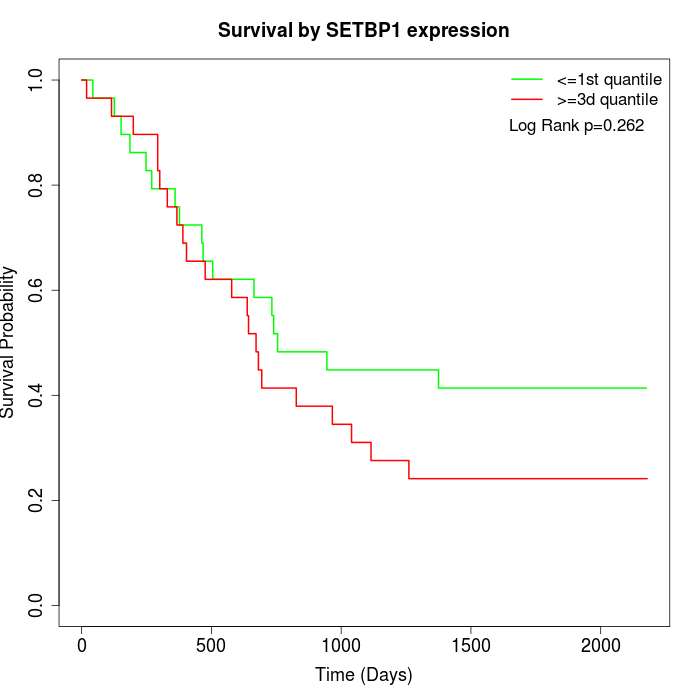 |  |
| GSE53622 | GSE53624 | TCGA |
Note: Click image to view full size file.
Copy number change of SETBP1:
| Dataset | Gene | EntrezID | Gain | Loss | Normal | Detail |
|---|---|---|---|---|---|---|
| GSE15526 | SETBP1 | 26040 | 1 | 8 | 21 | |
| GSE20123 | SETBP1 | 26040 | 1 | 8 | 21 | |
| GSE43470 | SETBP1 | 26040 | 1 | 4 | 38 | |
| GSE46452 | SETBP1 | 26040 | 1 | 25 | 33 | |
| GSE47630 | SETBP1 | 26040 | 5 | 20 | 15 | |
| GSE54993 | SETBP1 | 26040 | 8 | 1 | 61 | |
| GSE54994 | SETBP1 | 26040 | 2 | 15 | 36 | |
| GSE60625 | SETBP1 | 26040 | 0 | 4 | 7 | |
| GSE74703 | SETBP1 | 26040 | 1 | 3 | 32 | |
| GSE74704 | SETBP1 | 26040 | 0 | 6 | 14 | |
| TCGA | SETBP1 | 26040 | 15 | 39 | 42 |
Total number of gains: 35; Total number of losses: 133; Total Number of normals: 320.
Somatic mutations of SETBP1:
Generating mutation plots.
Highly correlated genes for SETBP1:
Showing top 20/740 corelated genes with mean PCC>0.5.
| Gene1 | Gene2 | Mean PCC | Num. Datasets | Num. PCC<0 | Num. PCC>0.5 |
|---|---|---|---|---|---|
| SETBP1 | APOB | 0.805146 | 3 | 0 | 3 |
| SETBP1 | C1orf216 | 0.745034 | 3 | 0 | 3 |
| SETBP1 | EID3 | 0.74461 | 3 | 0 | 3 |
| SETBP1 | RBMX2 | 0.742016 | 3 | 0 | 3 |
| SETBP1 | C11orf96 | 0.737809 | 3 | 0 | 3 |
| SETBP1 | PEG3 | 0.720523 | 5 | 0 | 5 |
| SETBP1 | NELL1 | 0.719724 | 3 | 0 | 3 |
| SETBP1 | DENND5B | 0.713763 | 4 | 0 | 4 |
| SETBP1 | HOXA4 | 0.707143 | 5 | 0 | 5 |
| SETBP1 | ARMC9 | 0.705519 | 3 | 0 | 3 |
| SETBP1 | MAMDC2 | 0.704527 | 5 | 0 | 5 |
| SETBP1 | TMOD1 | 0.704153 | 6 | 0 | 6 |
| SETBP1 | LIMS2 | 0.700063 | 7 | 0 | 7 |
| SETBP1 | CASC4 | 0.699809 | 3 | 0 | 3 |
| SETBP1 | MRGPRF | 0.698904 | 5 | 0 | 5 |
| SETBP1 | TMEM187 | 0.698816 | 3 | 0 | 3 |
| SETBP1 | CASQ2 | 0.69878 | 7 | 0 | 7 |
| SETBP1 | TCEAL3 | 0.696369 | 4 | 0 | 3 |
| SETBP1 | MRVI1 | 0.695616 | 6 | 0 | 5 |
| SETBP1 | GPS2 | 0.695342 | 4 | 0 | 3 |
For details and further investigation, click here