| Full name: calsequestrin 2 | Alias Symbol: PDIB2 | ||
| Type: protein-coding gene | Cytoband: 1p13.1 | ||
| Entrez ID: 845 | HGNC ID: HGNC:1513 | Ensembl Gene: ENSG00000118729 | OMIM ID: 114251 |
Expression of CASQ2:
| Dataset | Gene | EntrezID | Probe | Log2FC | Adj.pValue | Expression |
|---|---|---|---|---|---|---|
| GSE17351 | CASQ2 | 845 | 207317_s_at | -2.3891 | 0.0821 | |
| GSE20347 | CASQ2 | 845 | 207317_s_at | -0.5274 | 0.0572 | |
| GSE23400 | CASQ2 | 845 | 207317_s_at | -0.7760 | 0.0000 | |
| GSE26886 | CASQ2 | 845 | 207317_s_at | -0.2350 | 0.4286 | |
| GSE29001 | CASQ2 | 845 | 207317_s_at | -0.6417 | 0.0081 | |
| GSE38129 | CASQ2 | 845 | 207317_s_at | -1.5474 | 0.0008 | |
| GSE45670 | CASQ2 | 845 | 207317_s_at | -2.8235 | 0.0000 | |
| GSE53622 | CASQ2 | 845 | 165883 | -3.8256 | 0.0000 | |
| GSE53624 | CASQ2 | 845 | 165883 | -3.6626 | 0.0000 | |
| GSE63941 | CASQ2 | 845 | 207317_s_at | 0.2381 | 0.1848 | |
| GSE77861 | CASQ2 | 845 | 207317_s_at | -0.0534 | 0.7739 | |
| GSE97050 | CASQ2 | 845 | A_23_P126582 | -1.1427 | 0.1505 | |
| SRP064894 | CASQ2 | 845 | RNAseq | -1.5474 | 0.0018 | |
| SRP133303 | CASQ2 | 845 | RNAseq | -2.7700 | 0.0000 | |
| SRP219564 | CASQ2 | 845 | RNAseq | -2.1311 | 0.0954 | |
| TCGA | CASQ2 | 845 | RNAseq | -1.4559 | 0.0014 |
Upregulated datasets: 0; Downregulated datasets: 7.
Survival by CASQ2 expression:
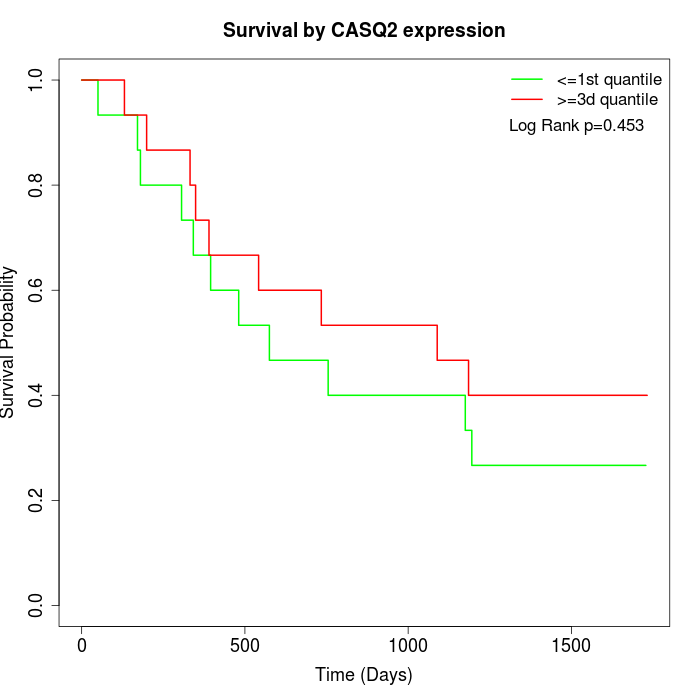 | 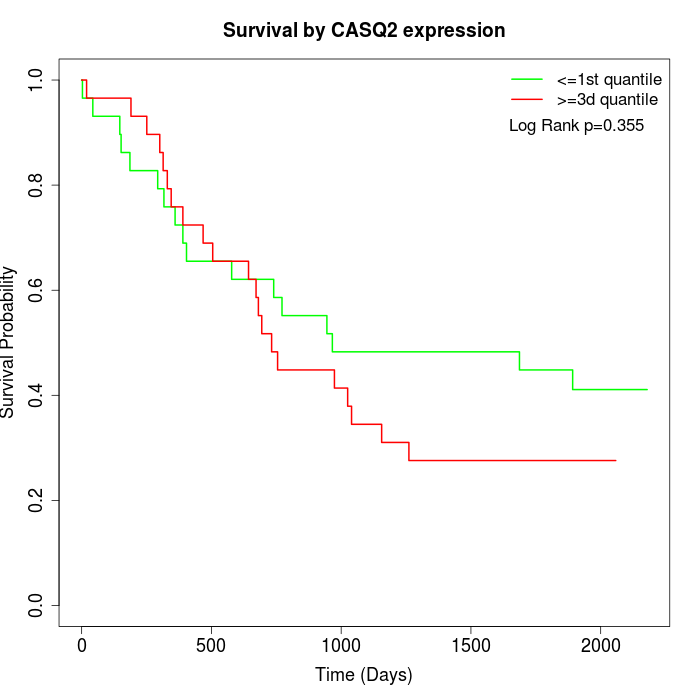 | 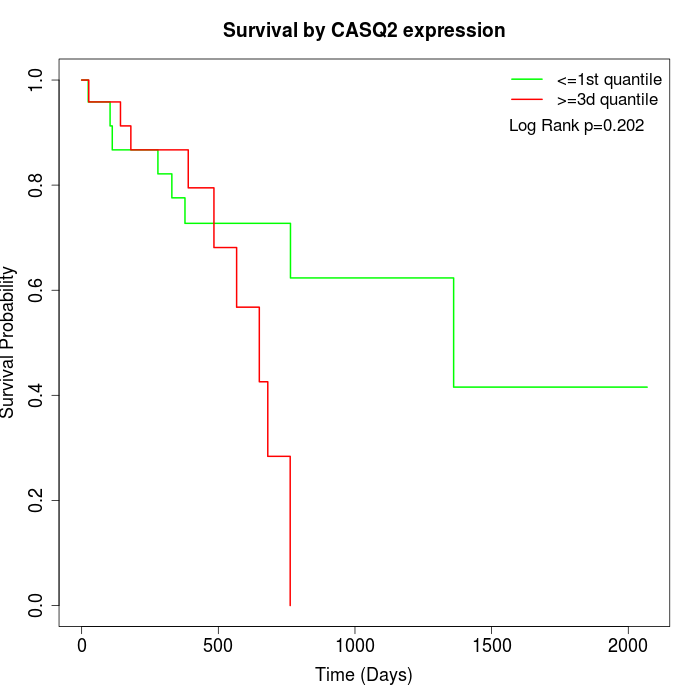 |
| GSE53622 | GSE53624 | TCGA |
Note: Click image to view full size file.
Copy number change of CASQ2:
| Dataset | Gene | EntrezID | Gain | Loss | Normal | Detail |
|---|---|---|---|---|---|---|
| GSE15526 | CASQ2 | 845 | 0 | 9 | 21 | |
| GSE20123 | CASQ2 | 845 | 0 | 9 | 21 | |
| GSE43470 | CASQ2 | 845 | 0 | 8 | 35 | |
| GSE46452 | CASQ2 | 845 | 2 | 1 | 56 | |
| GSE47630 | CASQ2 | 845 | 9 | 5 | 26 | |
| GSE54993 | CASQ2 | 845 | 0 | 1 | 69 | |
| GSE54994 | CASQ2 | 845 | 8 | 3 | 42 | |
| GSE60625 | CASQ2 | 845 | 0 | 0 | 11 | |
| GSE74703 | CASQ2 | 845 | 0 | 7 | 29 | |
| GSE74704 | CASQ2 | 845 | 0 | 5 | 15 | |
| TCGA | CASQ2 | 845 | 14 | 28 | 54 |
Total number of gains: 33; Total number of losses: 76; Total Number of normals: 379.
Somatic mutations of CASQ2:
Generating mutation plots.
Highly correlated genes for CASQ2:
Showing top 20/1264 corelated genes with mean PCC>0.5.
| Gene1 | Gene2 | Mean PCC | Num. Datasets | Num. PCC<0 | Num. PCC>0.5 |
|---|---|---|---|---|---|
| CASQ2 | SORCS1 | 0.901502 | 4 | 0 | 4 |
| CASQ2 | ANGPTL1 | 0.897561 | 6 | 0 | 6 |
| CASQ2 | PDZRN4 | 0.872352 | 9 | 0 | 9 |
| CASQ2 | C1QTNF7 | 0.870373 | 6 | 0 | 6 |
| CASQ2 | ASB5 | 0.865254 | 6 | 0 | 6 |
| CASQ2 | CLEC3B | 0.856271 | 3 | 0 | 3 |
| CASQ2 | PRUNE2 | 0.85564 | 10 | 0 | 10 |
| CASQ2 | CHRDL1 | 0.855019 | 9 | 0 | 9 |
| CASQ2 | CYP21A2 | 0.854735 | 3 | 0 | 3 |
| CASQ2 | LRFN5 | 0.843755 | 4 | 0 | 4 |
| CASQ2 | EIF4E3 | 0.84226 | 5 | 0 | 5 |
| CASQ2 | OGN | 0.840444 | 11 | 0 | 11 |
| CASQ2 | PPP1R12B | 0.831402 | 11 | 0 | 11 |
| CASQ2 | PYGM | 0.82983 | 10 | 0 | 10 |
| CASQ2 | KCNT2 | 0.82903 | 5 | 0 | 5 |
| CASQ2 | C7 | 0.826223 | 11 | 0 | 11 |
| CASQ2 | PTCHD1 | 0.824394 | 5 | 0 | 5 |
| CASQ2 | MTURN | 0.823644 | 4 | 0 | 4 |
| CASQ2 | PLN | 0.816763 | 11 | 0 | 10 |
| CASQ2 | AOC3 | 0.812457 | 11 | 0 | 10 |
For details and further investigation, click here