| Full name: surfactant protein C | Alias Symbol: SP-C|PSP-C|SMDP2|BRICD6 | ||
| Type: protein-coding gene | Cytoband: 8p21.3 | ||
| Entrez ID: 6440 | HGNC ID: HGNC:10802 | Ensembl Gene: ENSG00000168484 | OMIM ID: 178620 |
Expression of SFTPC:
| Dataset | Gene | EntrezID | Probe | Log2FC | Adj.pValue | Expression |
|---|---|---|---|---|---|---|
| GSE17351 | SFTPC | 6440 | 38691_s_at | -0.1043 | 0.6521 | |
| GSE20347 | SFTPC | 6440 | 38691_s_at | -0.0209 | 0.8613 | |
| GSE23400 | SFTPC | 6440 | 38691_s_at | -0.1839 | 0.0000 | |
| GSE26886 | SFTPC | 6440 | 38691_s_at | -0.4264 | 0.0185 | |
| GSE29001 | SFTPC | 6440 | 38691_s_at | -0.0819 | 0.7438 | |
| GSE38129 | SFTPC | 6440 | 38691_s_at | -0.0400 | 0.6685 | |
| GSE45670 | SFTPC | 6440 | 38691_s_at | 0.0384 | 0.6846 | |
| GSE53622 | SFTPC | 6440 | 3278 | -0.5370 | 0.0000 | |
| GSE53624 | SFTPC | 6440 | 3278 | -0.3977 | 0.0000 | |
| GSE63941 | SFTPC | 6440 | 38691_s_at | -0.1774 | 0.3999 | |
| GSE77861 | SFTPC | 6440 | 215454_x_at | -0.0312 | 0.8628 | |
| GSE97050 | SFTPC | 6440 | A_23_P95213 | 0.0195 | 0.9546 | |
| TCGA | SFTPC | 6440 | RNAseq | 0.7222 | 0.6748 |
Upregulated datasets: 0; Downregulated datasets: 0.
Survival by SFTPC expression:
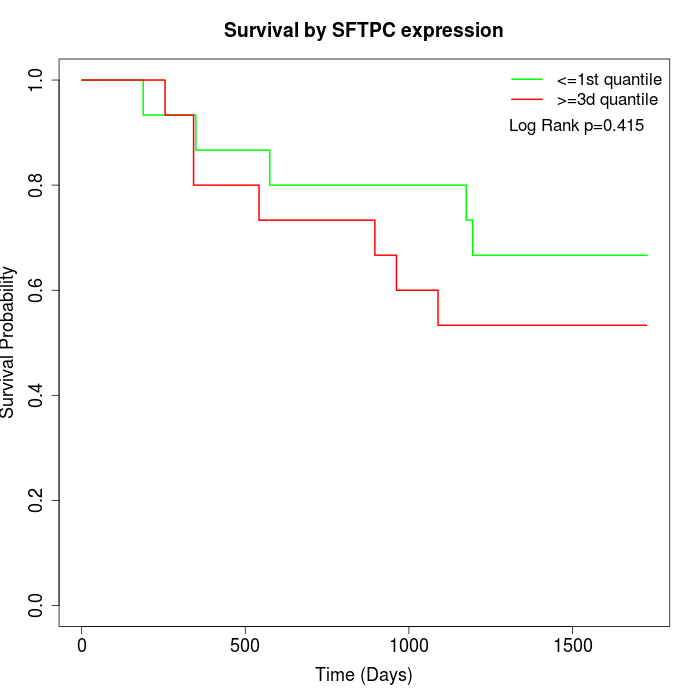 | 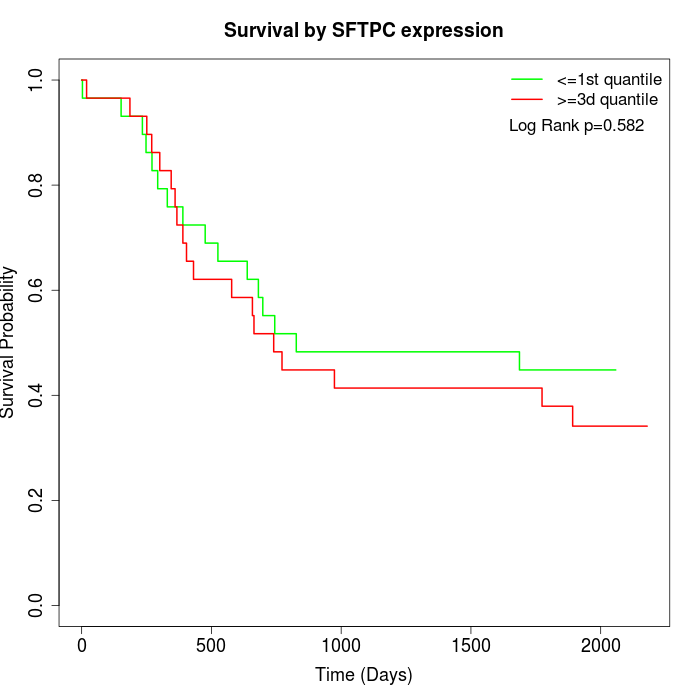 | 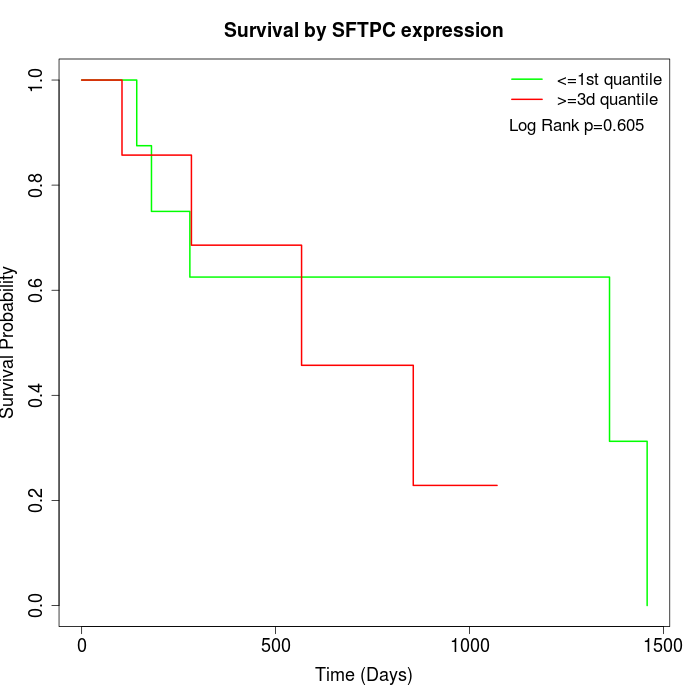 |
| GSE53622 | GSE53624 | TCGA |
Note: Click image to view full size file.
Copy number change of SFTPC:
| Dataset | Gene | EntrezID | Gain | Loss | Normal | Detail |
|---|---|---|---|---|---|---|
| GSE15526 | SFTPC | 6440 | 4 | 10 | 16 | |
| GSE20123 | SFTPC | 6440 | 4 | 10 | 16 | |
| GSE43470 | SFTPC | 6440 | 4 | 9 | 30 | |
| GSE46452 | SFTPC | 6440 | 13 | 13 | 33 | |
| GSE47630 | SFTPC | 6440 | 10 | 8 | 22 | |
| GSE54993 | SFTPC | 6440 | 2 | 14 | 54 | |
| GSE54994 | SFTPC | 6440 | 8 | 18 | 27 | |
| GSE60625 | SFTPC | 6440 | 3 | 0 | 8 | |
| GSE74703 | SFTPC | 6440 | 4 | 7 | 25 | |
| GSE74704 | SFTPC | 6440 | 3 | 7 | 10 | |
| TCGA | SFTPC | 6440 | 14 | 43 | 39 |
Total number of gains: 69; Total number of losses: 139; Total Number of normals: 280.
Somatic mutations of SFTPC:
Generating mutation plots.
Highly correlated genes for SFTPC:
Showing top 20/360 corelated genes with mean PCC>0.5.
| Gene1 | Gene2 | Mean PCC | Num. Datasets | Num. PCC<0 | Num. PCC>0.5 |
|---|---|---|---|---|---|
| SFTPC | TUT1 | 0.771105 | 3 | 0 | 3 |
| SFTPC | ZC3H10 | 0.745602 | 3 | 0 | 3 |
| SFTPC | CDC42BPB | 0.74355 | 3 | 0 | 3 |
| SFTPC | PGC | 0.730645 | 5 | 0 | 5 |
| SFTPC | TMEM221 | 0.711083 | 3 | 0 | 3 |
| SFTPC | SLC22A31 | 0.698037 | 4 | 0 | 3 |
| SFTPC | IGSF9B | 0.695785 | 5 | 0 | 4 |
| SFTPC | POLM | 0.694214 | 3 | 0 | 3 |
| SFTPC | ACAD10 | 0.693763 | 4 | 0 | 3 |
| SFTPC | PRKAR1B | 0.679768 | 3 | 0 | 3 |
| SFTPC | DOHH | 0.677898 | 4 | 0 | 3 |
| SFTPC | GRIPAP1 | 0.675325 | 3 | 0 | 3 |
| SFTPC | EML2 | 0.672013 | 5 | 0 | 4 |
| SFTPC | DRD2 | 0.670582 | 5 | 0 | 4 |
| SFTPC | ROM1 | 0.668009 | 4 | 0 | 3 |
| SFTPC | PTPRN2 | 0.664163 | 4 | 0 | 4 |
| SFTPC | GPT | 0.658821 | 6 | 0 | 6 |
| SFTPC | IQCD | 0.657496 | 4 | 0 | 3 |
| SFTPC | GFRA2 | 0.655811 | 4 | 0 | 3 |
| SFTPC | MT3 | 0.654566 | 4 | 0 | 4 |
For details and further investigation, click here