| Full name: Src like adaptor | Alias Symbol: SLA1|SLAP-1|hSLAP|SLAP | ||
| Type: protein-coding gene | Cytoband: 8q24.22 | ||
| Entrez ID: 6503 | HGNC ID: HGNC:10902 | Ensembl Gene: ENSG00000155926 | OMIM ID: 601099 |
Expression of SLA:
| Dataset | Gene | EntrezID | Probe | Log2FC | Adj.pValue | Expression |
|---|---|---|---|---|---|---|
| GSE17351 | SLA | 6503 | 203761_at | 0.7365 | 0.5413 | |
| GSE20347 | SLA | 6503 | 203760_s_at | 0.1056 | 0.6337 | |
| GSE23400 | SLA | 6503 | 203761_at | 0.1340 | 0.0618 | |
| GSE26886 | SLA | 6503 | 203760_s_at | -0.2623 | 0.3336 | |
| GSE29001 | SLA | 6503 | 203761_at | 0.0467 | 0.8359 | |
| GSE38129 | SLA | 6503 | 203760_s_at | 0.0699 | 0.7386 | |
| GSE45670 | SLA | 6503 | 203761_at | 0.0648 | 0.8131 | |
| GSE53622 | SLA | 6503 | 90956 | 0.2087 | 0.2080 | |
| GSE53624 | SLA | 6503 | 90956 | 0.2956 | 0.0269 | |
| GSE63941 | SLA | 6503 | 203760_s_at | -0.1002 | 0.5665 | |
| GSE77861 | SLA | 6503 | 203760_s_at | -0.0609 | 0.6441 | |
| GSE97050 | SLA | 6503 | A_23_P216340 | 0.6755 | 0.1462 | |
| SRP007169 | SLA | 6503 | RNAseq | 1.5297 | 0.0553 | |
| SRP008496 | SLA | 6503 | RNAseq | 1.4079 | 0.0042 | |
| SRP064894 | SLA | 6503 | RNAseq | 0.7664 | 0.0266 | |
| SRP133303 | SLA | 6503 | RNAseq | 0.4151 | 0.0343 | |
| SRP159526 | SLA | 6503 | RNAseq | -0.1759 | 0.8330 | |
| SRP193095 | SLA | 6503 | RNAseq | 0.4907 | 0.0344 | |
| SRP219564 | SLA | 6503 | RNAseq | 1.1166 | 0.0101 | |
| TCGA | SLA | 6503 | RNAseq | -0.1010 | 0.4522 |
Upregulated datasets: 2; Downregulated datasets: 0.
Survival by SLA expression:
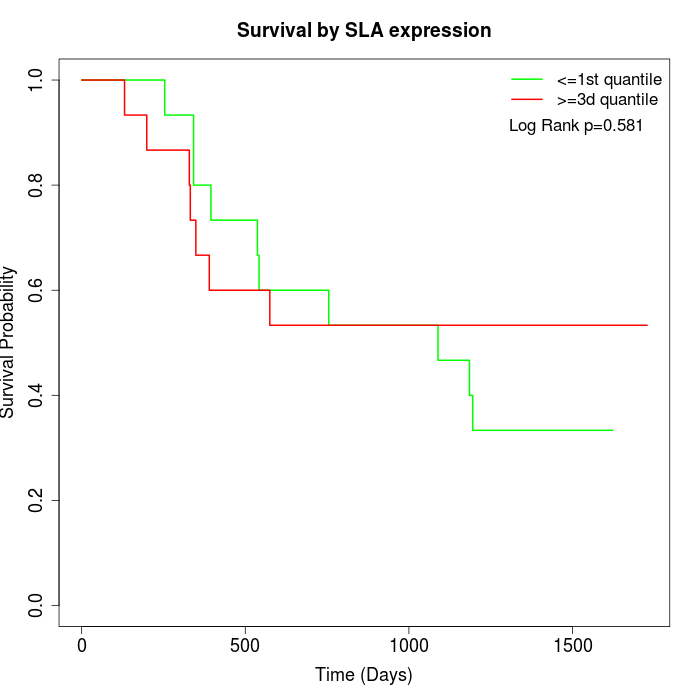 | 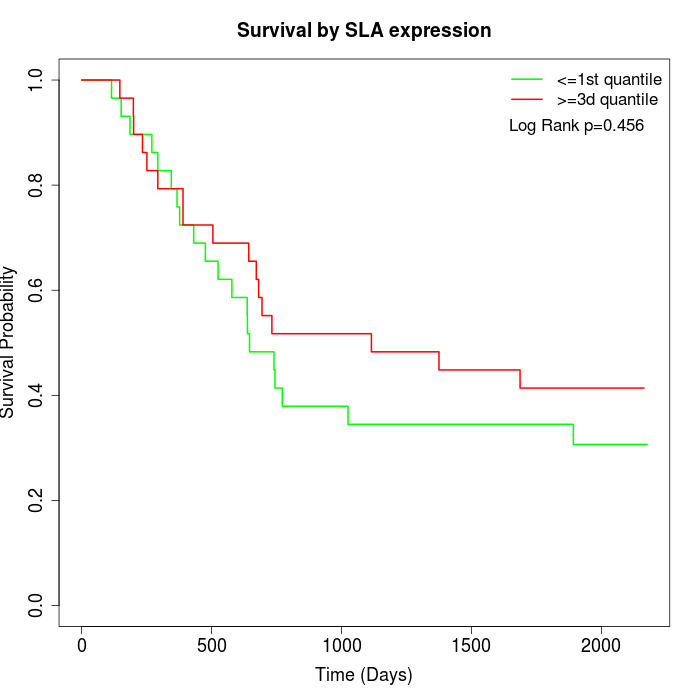 | 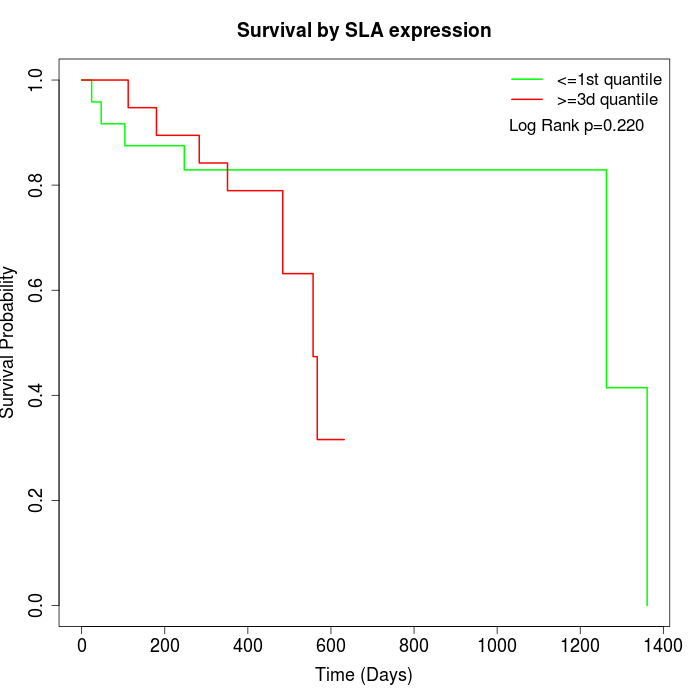 |
| GSE53622 | GSE53624 | TCGA |
Note: Click image to view full size file.
Copy number change of SLA:
| Dataset | Gene | EntrezID | Gain | Loss | Normal | Detail |
|---|---|---|---|---|---|---|
| GSE15526 | SLA | 6503 | 16 | 0 | 14 | |
| GSE20123 | SLA | 6503 | 17 | 0 | 13 | |
| GSE43470 | SLA | 6503 | 23 | 1 | 19 | |
| GSE46452 | SLA | 6503 | 27 | 0 | 32 | |
| GSE47630 | SLA | 6503 | 24 | 0 | 16 | |
| GSE54993 | SLA | 6503 | 0 | 24 | 46 | |
| GSE54994 | SLA | 6503 | 39 | 1 | 13 | |
| GSE60625 | SLA | 6503 | 0 | 7 | 4 | |
| GSE74703 | SLA | 6503 | 20 | 0 | 16 | |
| GSE74704 | SLA | 6503 | 12 | 0 | 8 | |
| TCGA | SLA | 6503 | 66 | 2 | 28 |
Total number of gains: 244; Total number of losses: 35; Total Number of normals: 209.
Somatic mutations of SLA:
Generating mutation plots.
Highly correlated genes for SLA:
Showing top 20/442 corelated genes with mean PCC>0.5.
| Gene1 | Gene2 | Mean PCC | Num. Datasets | Num. PCC<0 | Num. PCC>0.5 |
|---|---|---|---|---|---|
| SLA | GMFG | 0.781922 | 11 | 0 | 11 |
| SLA | NCKAP1L | 0.766502 | 10 | 0 | 10 |
| SLA | CD53 | 0.763441 | 10 | 0 | 9 |
| SLA | PSMB8-AS1 | 0.759242 | 4 | 0 | 4 |
| SLA | TNFAIP8L2 | 0.750355 | 6 | 0 | 6 |
| SLA | LCK | 0.749033 | 10 | 0 | 10 |
| SLA | CCR5 | 0.748922 | 10 | 0 | 10 |
| SLA | IL10RA | 0.743959 | 10 | 0 | 9 |
| SLA | SASH3 | 0.742887 | 12 | 0 | 11 |
| SLA | ARHGDIB | 0.737958 | 10 | 0 | 10 |
| SLA | CYTIP | 0.737524 | 11 | 0 | 10 |
| SLA | GPR65 | 0.732938 | 11 | 0 | 11 |
| SLA | EVI2B | 0.72467 | 12 | 0 | 11 |
| SLA | SELPLG | 0.720996 | 5 | 0 | 5 |
| SLA | ARHGAP9 | 0.720845 | 7 | 0 | 6 |
| SLA | LAPTM5 | 0.720388 | 11 | 0 | 10 |
| SLA | ITGB2 | 0.717333 | 11 | 0 | 10 |
| SLA | IRF8 | 0.713951 | 11 | 0 | 11 |
| SLA | TNFRSF1B | 0.713586 | 11 | 0 | 10 |
| SLA | SELL | 0.712417 | 10 | 0 | 8 |
For details and further investigation, click here