| Full name: solute carrier family 18 member A1 | Alias Symbol: CGAT | ||
| Type: protein-coding gene | Cytoband: 8p21.3 | ||
| Entrez ID: 6570 | HGNC ID: HGNC:10934 | Ensembl Gene: ENSG00000036565 | OMIM ID: 193002 |
| Related drugs: KETANSERIN, METHAMPHETAMINE, RESERPINE, TETRABENAZINE... [more] | |||
Expression of SLC18A1:
| Dataset | Gene | EntrezID | Probe | Log2FC | Adj.pValue | Expression |
|---|---|---|---|---|---|---|
| GSE17351 | SLC18A1 | 6570 | 207074_s_at | -0.0318 | 0.9082 | |
| GSE20347 | SLC18A1 | 6570 | 207074_s_at | 0.0064 | 0.9359 | |
| GSE23400 | SLC18A1 | 6570 | 207074_s_at | -0.1720 | 0.0002 | |
| GSE26886 | SLC18A1 | 6570 | 207074_s_at | 0.0271 | 0.8486 | |
| GSE29001 | SLC18A1 | 6570 | 207074_s_at | -0.1670 | 0.4199 | |
| GSE38129 | SLC18A1 | 6570 | 207074_s_at | -0.1442 | 0.0443 | |
| GSE45670 | SLC18A1 | 6570 | 207074_s_at | -0.0740 | 0.4176 | |
| GSE53622 | SLC18A1 | 6570 | 60467 | -0.2364 | 0.0177 | |
| GSE53624 | SLC18A1 | 6570 | 60467 | -0.1803 | 0.1068 | |
| GSE63941 | SLC18A1 | 6570 | 207074_s_at | 0.1084 | 0.3717 | |
| GSE77861 | SLC18A1 | 6570 | 207074_s_at | -0.1086 | 0.2010 | |
| TCGA | SLC18A1 | 6570 | RNAseq | -4.5129 | 0.0010 |
Upregulated datasets: 0; Downregulated datasets: 1.
Survival by SLC18A1 expression:
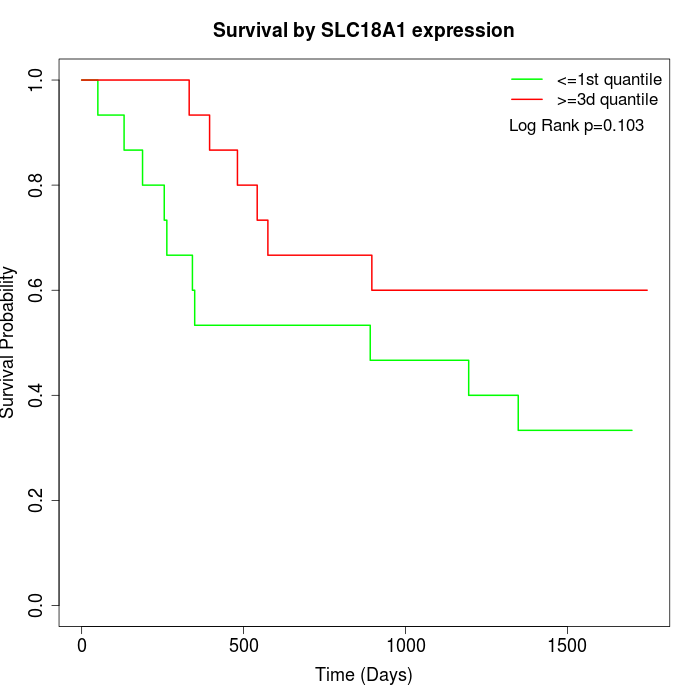 | 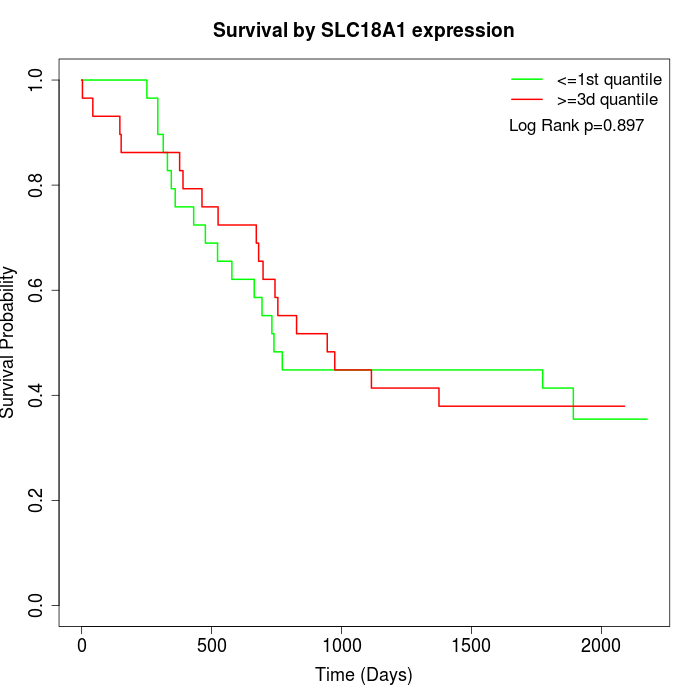 | 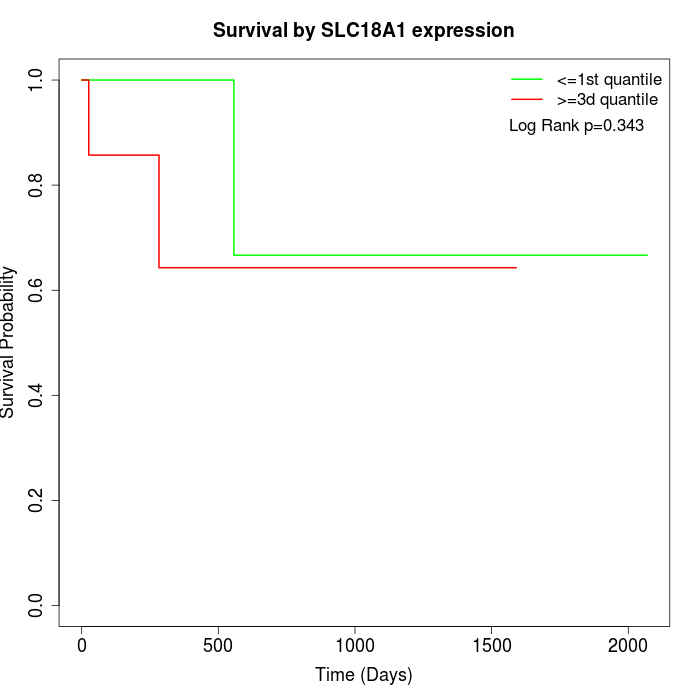 |
| GSE53622 | GSE53624 | TCGA |
Note: Click image to view full size file.
Copy number change of SLC18A1:
| Dataset | Gene | EntrezID | Gain | Loss | Normal | Detail |
|---|---|---|---|---|---|---|
| GSE15526 | SLC18A1 | 6570 | 4 | 10 | 16 | |
| GSE20123 | SLC18A1 | 6570 | 4 | 10 | 16 | |
| GSE43470 | SLC18A1 | 6570 | 4 | 8 | 31 | |
| GSE46452 | SLC18A1 | 6570 | 14 | 13 | 32 | |
| GSE47630 | SLC18A1 | 6570 | 10 | 8 | 22 | |
| GSE54993 | SLC18A1 | 6570 | 2 | 14 | 54 | |
| GSE54994 | SLC18A1 | 6570 | 8 | 18 | 27 | |
| GSE60625 | SLC18A1 | 6570 | 3 | 0 | 8 | |
| GSE74703 | SLC18A1 | 6570 | 4 | 7 | 25 | |
| GSE74704 | SLC18A1 | 6570 | 3 | 6 | 11 | |
| TCGA | SLC18A1 | 6570 | 14 | 42 | 40 |
Total number of gains: 70; Total number of losses: 136; Total Number of normals: 282.
Somatic mutations of SLC18A1:
Generating mutation plots.
Highly correlated genes for SLC18A1:
Showing top 20/790 corelated genes with mean PCC>0.5.
| Gene1 | Gene2 | Mean PCC | Num. Datasets | Num. PCC<0 | Num. PCC>0.5 |
|---|---|---|---|---|---|
| SLC18A1 | NOX1 | 0.708886 | 3 | 0 | 3 |
| SLC18A1 | AICDA | 0.702371 | 3 | 0 | 3 |
| SLC18A1 | CYP2A6 | 0.692551 | 6 | 0 | 5 |
| SLC18A1 | ACSBG2 | 0.680091 | 3 | 0 | 3 |
| SLC18A1 | TSSK6 | 0.679585 | 3 | 0 | 3 |
| SLC18A1 | KCNC1 | 0.674072 | 4 | 0 | 4 |
| SLC18A1 | GJB4 | 0.665481 | 5 | 0 | 4 |
| SLC18A1 | GPC5 | 0.665155 | 3 | 0 | 3 |
| SLC18A1 | FAM153A | 0.66086 | 5 | 0 | 4 |
| SLC18A1 | SLC17A3 | 0.658547 | 5 | 0 | 4 |
| SLC18A1 | TAS2R9 | 0.658174 | 5 | 0 | 5 |
| SLC18A1 | MSH4 | 0.656857 | 4 | 0 | 4 |
| SLC18A1 | HAL | 0.656847 | 4 | 0 | 4 |
| SLC18A1 | OR1D2 | 0.653405 | 5 | 0 | 4 |
| SLC18A1 | KALRN | 0.650518 | 3 | 0 | 3 |
| SLC18A1 | KEL | 0.648181 | 3 | 0 | 3 |
| SLC18A1 | NCR1 | 0.647704 | 4 | 0 | 4 |
| SLC18A1 | VGF | 0.647318 | 4 | 0 | 3 |
| SLC18A1 | LIPF | 0.647014 | 3 | 0 | 3 |
| SLC18A1 | GPR37L1 | 0.646896 | 5 | 0 | 5 |
For details and further investigation, click here