| Full name: slit guidance ligand 1 | Alias Symbol: slit1|MEGF4|Slit-1|SLIT3 | ||
| Type: protein-coding gene | Cytoband: 10q24.1 | ||
| Entrez ID: 6585 | HGNC ID: HGNC:11085 | Ensembl Gene: ENSG00000187122 | OMIM ID: 603742 |
Screen Evidence:
| |||
SLIT1 involved pathways:
| KEGG pathway | Description | View |
|---|---|---|
| hsa04360 | Axon guidance |
Expression of SLIT1:
| Dataset | Gene | EntrezID | Probe | Log2FC | Adj.pValue | Expression |
|---|---|---|---|---|---|---|
| GSE17351 | SLIT1 | 6585 | 213601_at | 0.0457 | 0.8753 | |
| GSE20347 | SLIT1 | 6585 | 213601_at | -0.1277 | 0.1347 | |
| GSE23400 | SLIT1 | 6585 | 213601_at | -0.0378 | 0.3365 | |
| GSE26886 | SLIT1 | 6585 | 213601_at | 0.2669 | 0.0269 | |
| GSE29001 | SLIT1 | 6585 | 213601_at | -0.0518 | 0.7885 | |
| GSE38129 | SLIT1 | 6585 | 208221_s_at | -0.1514 | 0.0234 | |
| GSE45670 | SLIT1 | 6585 | 213601_at | 0.1263 | 0.3092 | |
| GSE53622 | SLIT1 | 6585 | 132155 | -1.2717 | 0.0000 | |
| GSE53624 | SLIT1 | 6585 | 132155 | -1.3135 | 0.0000 | |
| GSE63941 | SLIT1 | 6585 | 213601_at | 0.3399 | 0.1156 | |
| GSE77861 | SLIT1 | 6585 | 213601_at | -0.0247 | 0.8439 | |
| SRP133303 | SLIT1 | 6585 | RNAseq | -0.2426 | 0.3559 | |
| SRP159526 | SLIT1 | 6585 | RNAseq | 2.1133 | 0.0037 | |
| TCGA | SLIT1 | 6585 | RNAseq | -0.6933 | 0.0727 |
Upregulated datasets: 1; Downregulated datasets: 2.
Survival by SLIT1 expression:
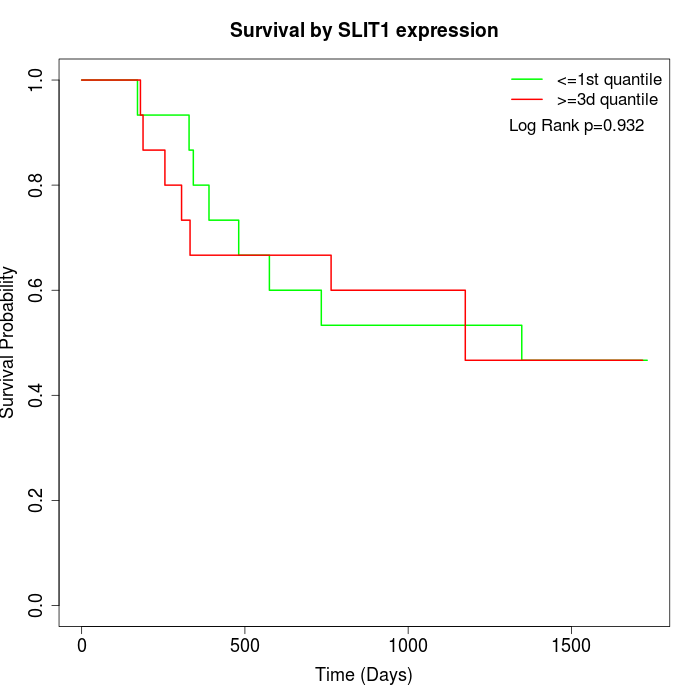 | 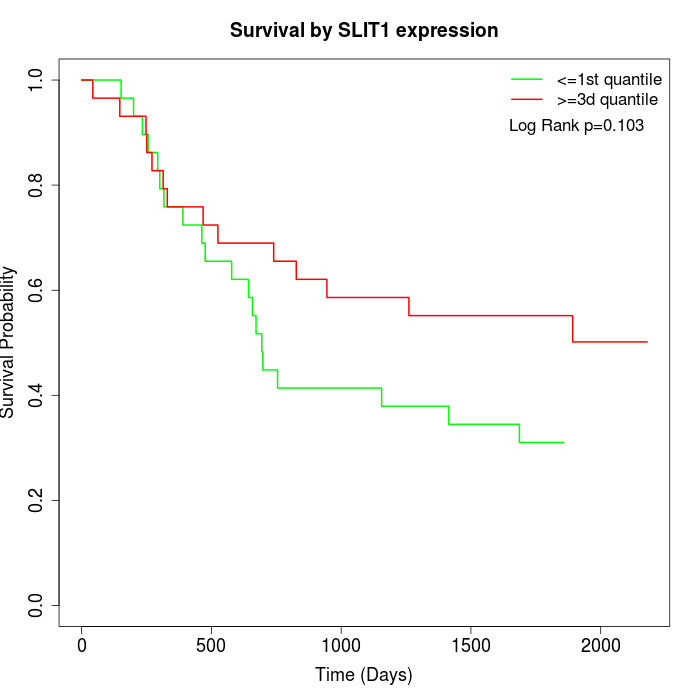 | 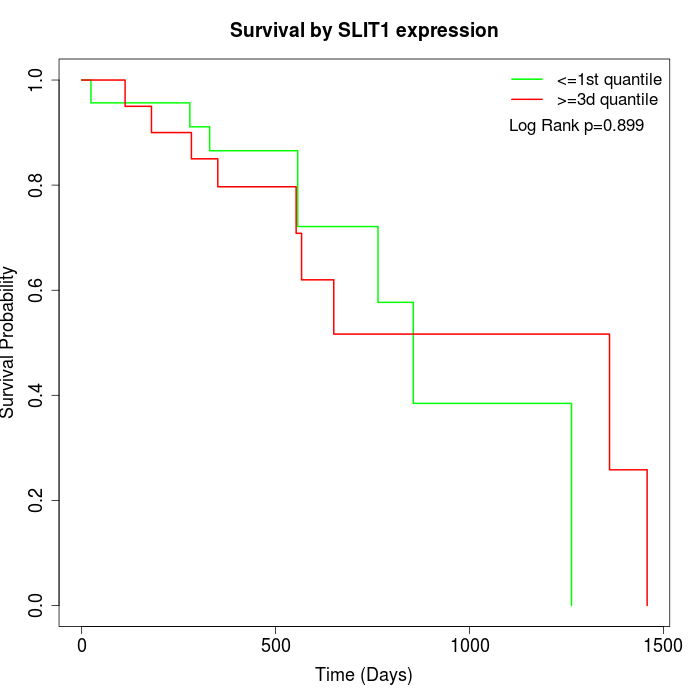 |
| GSE53622 | GSE53624 | TCGA |
Note: Click image to view full size file.
Copy number change of SLIT1:
| Dataset | Gene | EntrezID | Gain | Loss | Normal | Detail |
|---|---|---|---|---|---|---|
| GSE15526 | SLIT1 | 6585 | 0 | 8 | 22 | |
| GSE20123 | SLIT1 | 6585 | 0 | 7 | 23 | |
| GSE43470 | SLIT1 | 6585 | 0 | 7 | 36 | |
| GSE46452 | SLIT1 | 6585 | 0 | 11 | 48 | |
| GSE47630 | SLIT1 | 6585 | 2 | 14 | 24 | |
| GSE54993 | SLIT1 | 6585 | 7 | 0 | 63 | |
| GSE54994 | SLIT1 | 6585 | 2 | 10 | 41 | |
| GSE60625 | SLIT1 | 6585 | 0 | 0 | 11 | |
| GSE74703 | SLIT1 | 6585 | 0 | 5 | 31 | |
| GSE74704 | SLIT1 | 6585 | 0 | 4 | 16 | |
| TCGA | SLIT1 | 6585 | 5 | 28 | 63 |
Total number of gains: 16; Total number of losses: 94; Total Number of normals: 378.
Somatic mutations of SLIT1:
Generating mutation plots.
Highly correlated genes for SLIT1:
Showing top 20/612 corelated genes with mean PCC>0.5.
| Gene1 | Gene2 | Mean PCC | Num. Datasets | Num. PCC<0 | Num. PCC>0.5 |
|---|---|---|---|---|---|
| SLIT1 | NTNG1 | 0.734479 | 5 | 0 | 5 |
| SLIT1 | RPUSD1 | 0.710037 | 4 | 0 | 4 |
| SLIT1 | BTBD19 | 0.699913 | 4 | 0 | 4 |
| SLIT1 | MIER2 | 0.691763 | 3 | 0 | 3 |
| SLIT1 | SFRP5 | 0.681501 | 5 | 0 | 4 |
| SLIT1 | OR5AS1 | 0.671902 | 3 | 0 | 3 |
| SLIT1 | IL11RA | 0.659909 | 5 | 0 | 4 |
| SLIT1 | MFSD2B | 0.659043 | 3 | 0 | 3 |
| SLIT1 | HES5 | 0.655733 | 3 | 0 | 3 |
| SLIT1 | IL17F | 0.653694 | 3 | 0 | 3 |
| SLIT1 | CCDC151 | 0.650514 | 4 | 0 | 3 |
| SLIT1 | RHAG | 0.649962 | 5 | 0 | 5 |
| SLIT1 | SLC11A1 | 0.648257 | 4 | 0 | 3 |
| SLIT1 | MASP2 | 0.646913 | 7 | 0 | 5 |
| SLIT1 | DOK7 | 0.644588 | 3 | 0 | 3 |
| SLIT1 | BTN1A1 | 0.642826 | 5 | 0 | 5 |
| SLIT1 | CACNA1H | 0.642758 | 3 | 0 | 3 |
| SLIT1 | WFIKKN2 | 0.635256 | 3 | 0 | 3 |
| SLIT1 | GP5 | 0.63467 | 3 | 0 | 3 |
| SLIT1 | PDE6B | 0.633018 | 5 | 0 | 5 |
For details and further investigation, click here