| Full name: cytoplasmic polyadenylation element binding protein 3 | Alias Symbol: KIAA0940 | ||
| Type: protein-coding gene | Cytoband: 10q23.32 | ||
| Entrez ID: 22849 | HGNC ID: HGNC:21746 | Ensembl Gene: ENSG00000107864 | OMIM ID: 610606 |
CPEB3 involved pathways:
| KEGG pathway | Description | View |
|---|---|---|
| hsa04114 | Oocyte meiosis |
Expression of CPEB3:
| Dataset | Gene | EntrezID | Probe | Log2FC | Adj.pValue | Expression |
|---|---|---|---|---|---|---|
| GSE17351 | CPEB3 | 22849 | 205773_at | -1.8348 | 0.0086 | |
| GSE20347 | CPEB3 | 22849 | 205773_at | -2.2061 | 0.0000 | |
| GSE23400 | CPEB3 | 22849 | 205773_at | -1.2034 | 0.0000 | |
| GSE26886 | CPEB3 | 22849 | 205773_at | -3.4535 | 0.0000 | |
| GSE29001 | CPEB3 | 22849 | 205773_at | -1.8749 | 0.0000 | |
| GSE38129 | CPEB3 | 22849 | 205773_at | -2.0495 | 0.0000 | |
| GSE45670 | CPEB3 | 22849 | 205773_at | -0.9112 | 0.0155 | |
| GSE53622 | CPEB3 | 22849 | 14921 | -2.1575 | 0.0000 | |
| GSE53624 | CPEB3 | 22849 | 14921 | -2.4049 | 0.0000 | |
| GSE63941 | CPEB3 | 22849 | 243651_at | 0.3539 | 0.0262 | |
| GSE77861 | CPEB3 | 22849 | 243651_at | -0.0358 | 0.8127 | |
| GSE97050 | CPEB3 | 22849 | A_23_P46812 | -0.5357 | 0.1403 | |
| SRP007169 | CPEB3 | 22849 | RNAseq | -2.0615 | 0.0000 | |
| SRP064894 | CPEB3 | 22849 | RNAseq | -1.8841 | 0.0000 | |
| SRP133303 | CPEB3 | 22849 | RNAseq | -1.5914 | 0.0000 | |
| SRP159526 | CPEB3 | 22849 | RNAseq | -2.2118 | 0.0000 | |
| SRP193095 | CPEB3 | 22849 | RNAseq | -1.8232 | 0.0000 | |
| SRP219564 | CPEB3 | 22849 | RNAseq | -1.2070 | 0.0020 | |
| TCGA | CPEB3 | 22849 | RNAseq | -0.6155 | 0.0000 |
Upregulated datasets: 0; Downregulated datasets: 14.
Survival by CPEB3 expression:
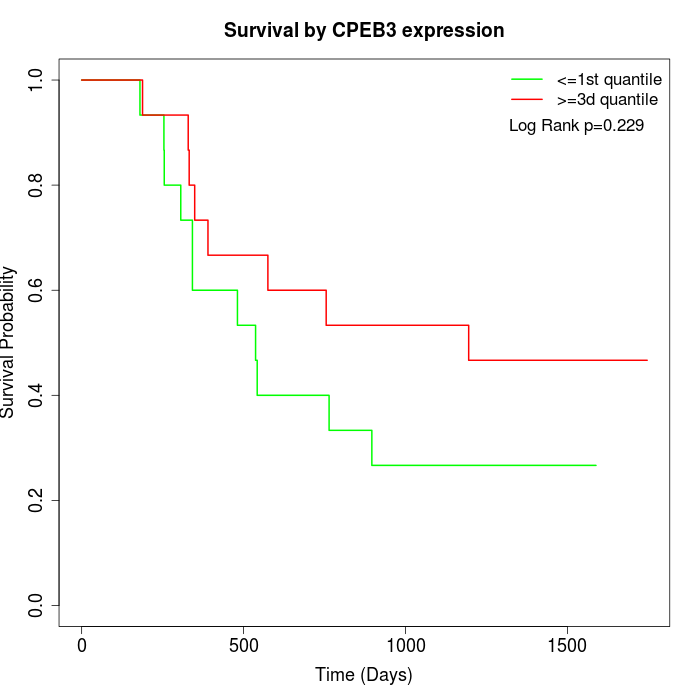 | 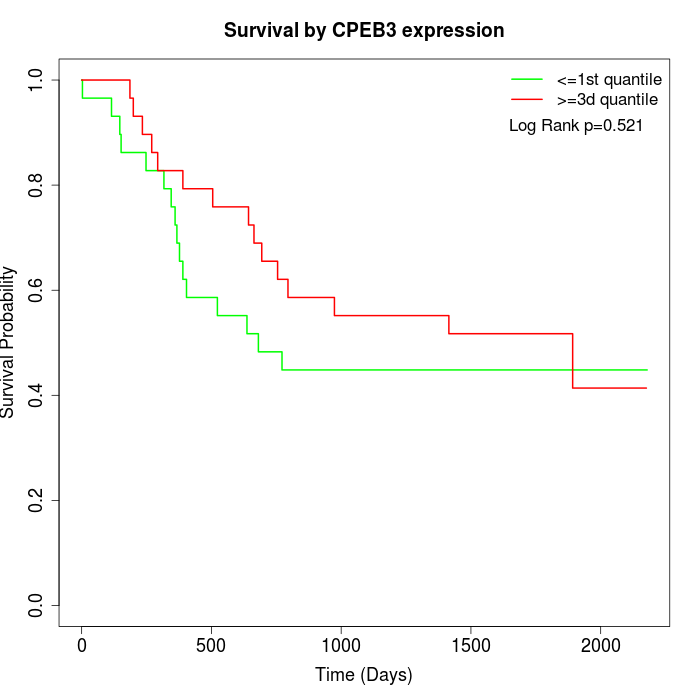 | 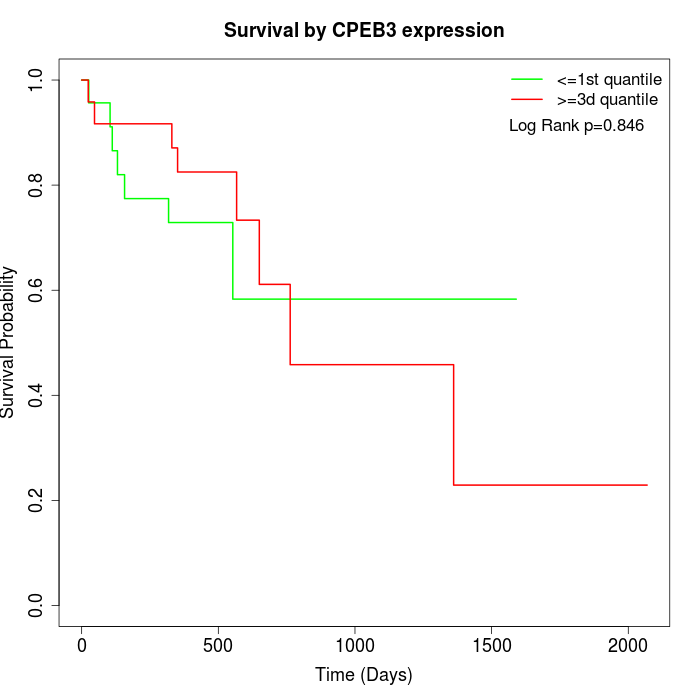 |
| GSE53622 | GSE53624 | TCGA |
Note: Click image to view full size file.
Copy number change of CPEB3:
| Dataset | Gene | EntrezID | Gain | Loss | Normal | Detail |
|---|---|---|---|---|---|---|
| GSE15526 | CPEB3 | 22849 | 2 | 7 | 21 | |
| GSE20123 | CPEB3 | 22849 | 2 | 6 | 22 | |
| GSE43470 | CPEB3 | 22849 | 0 | 8 | 35 | |
| GSE46452 | CPEB3 | 22849 | 0 | 11 | 48 | |
| GSE47630 | CPEB3 | 22849 | 2 | 14 | 24 | |
| GSE54993 | CPEB3 | 22849 | 7 | 0 | 63 | |
| GSE54994 | CPEB3 | 22849 | 1 | 10 | 42 | |
| GSE60625 | CPEB3 | 22849 | 0 | 0 | 11 | |
| GSE74703 | CPEB3 | 22849 | 0 | 6 | 30 | |
| GSE74704 | CPEB3 | 22849 | 0 | 4 | 16 | |
| TCGA | CPEB3 | 22849 | 7 | 28 | 61 |
Total number of gains: 21; Total number of losses: 94; Total Number of normals: 373.
Somatic mutations of CPEB3:
Generating mutation plots.
Highly correlated genes for CPEB3:
Showing top 20/1334 corelated genes with mean PCC>0.5.
| Gene1 | Gene2 | Mean PCC | Num. Datasets | Num. PCC<0 | Num. PCC>0.5 |
|---|---|---|---|---|---|
| CPEB3 | GBP6 | 0.853376 | 3 | 0 | 3 |
| CPEB3 | HPGD | 0.8517 | 10 | 0 | 10 |
| CPEB3 | SNORA68 | 0.848375 | 3 | 0 | 3 |
| CPEB3 | CAST | 0.844781 | 10 | 0 | 10 |
| CPEB3 | FCHO2 | 0.844671 | 6 | 0 | 6 |
| CPEB3 | SCNN1B | 0.841069 | 9 | 0 | 9 |
| CPEB3 | ARHGEF10L | 0.835411 | 10 | 0 | 10 |
| CPEB3 | SORT1 | 0.833122 | 10 | 0 | 10 |
| CPEB3 | CLCA4 | 0.830337 | 9 | 0 | 9 |
| CPEB3 | MPP7 | 0.828405 | 7 | 0 | 7 |
| CPEB3 | SPINK5 | 0.824946 | 9 | 0 | 9 |
| CPEB3 | RMND5B | 0.822912 | 11 | 0 | 10 |
| CPEB3 | ACPP | 0.81999 | 9 | 0 | 9 |
| CPEB3 | LNX1 | 0.817967 | 6 | 0 | 6 |
| CPEB3 | SFTA2 | 0.817874 | 3 | 0 | 3 |
| CPEB3 | CRISP3 | 0.816487 | 10 | 0 | 10 |
| CPEB3 | EMP1 | 0.81561 | 9 | 0 | 9 |
| CPEB3 | TJP1 | 0.809597 | 10 | 0 | 10 |
| CPEB3 | ANXA9 | 0.808799 | 10 | 0 | 10 |
| CPEB3 | CXCR2 | 0.808506 | 10 | 0 | 10 |
For details and further investigation, click here