| Full name: cortactin binding protein 2 | Alias Symbol: KIAA1758|Orf4 | ||
| Type: protein-coding gene | Cytoband: 7q31.31 | ||
| Entrez ID: 83992 | HGNC ID: HGNC:15679 | Ensembl Gene: ENSG00000077063 | OMIM ID: 609772 |
Expression of CTTNBP2:
| Dataset | Gene | EntrezID | Probe | Log2FC | Adj.pValue | Expression |
|---|---|---|---|---|---|---|
| GSE17351 | CTTNBP2 | 83992 | 232136_s_at | -3.2422 | 0.0088 | |
| GSE26886 | CTTNBP2 | 83992 | 232136_s_at | -2.8938 | 0.0000 | |
| GSE45670 | CTTNBP2 | 83992 | 232136_s_at | -2.1712 | 0.0050 | |
| GSE53622 | CTTNBP2 | 83992 | 15051 | -3.0132 | 0.0000 | |
| GSE53624 | CTTNBP2 | 83992 | 15051 | -3.5680 | 0.0000 | |
| GSE63941 | CTTNBP2 | 83992 | 232136_s_at | -2.3761 | 0.0000 | |
| GSE77861 | CTTNBP2 | 83992 | 232136_s_at | -1.5768 | 0.0021 | |
| GSE97050 | CTTNBP2 | 83992 | A_23_P215744 | -1.2592 | 0.2113 | |
| SRP007169 | CTTNBP2 | 83992 | RNAseq | -3.4497 | 0.0000 | |
| SRP008496 | CTTNBP2 | 83992 | RNAseq | -3.1096 | 0.0000 | |
| SRP064894 | CTTNBP2 | 83992 | RNAseq | -2.2820 | 0.0000 | |
| SRP133303 | CTTNBP2 | 83992 | RNAseq | -2.4695 | 0.0000 | |
| SRP159526 | CTTNBP2 | 83992 | RNAseq | -2.3682 | 0.0000 | |
| SRP193095 | CTTNBP2 | 83992 | RNAseq | -3.3542 | 0.0000 | |
| SRP219564 | CTTNBP2 | 83992 | RNAseq | -2.1692 | 0.0012 | |
| TCGA | CTTNBP2 | 83992 | RNAseq | -0.3778 | 0.2482 |
Upregulated datasets: 0; Downregulated datasets: 14.
Survival by CTTNBP2 expression:
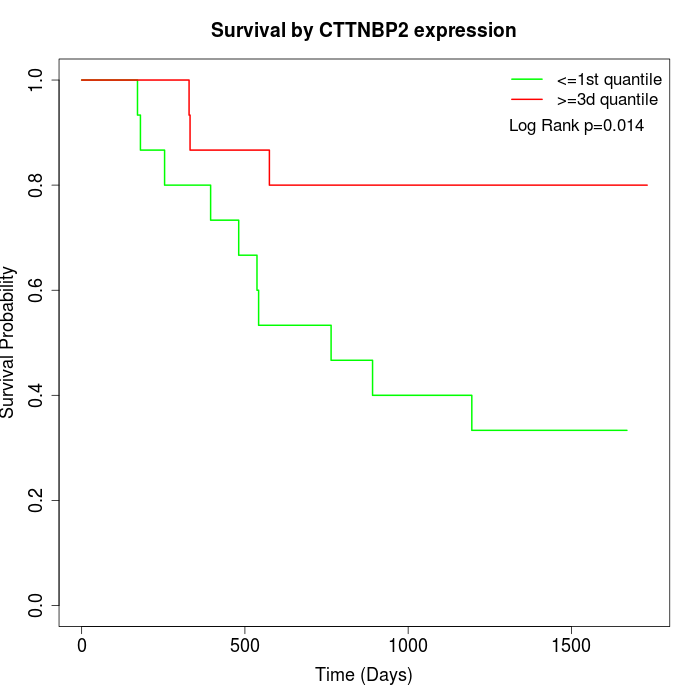 | 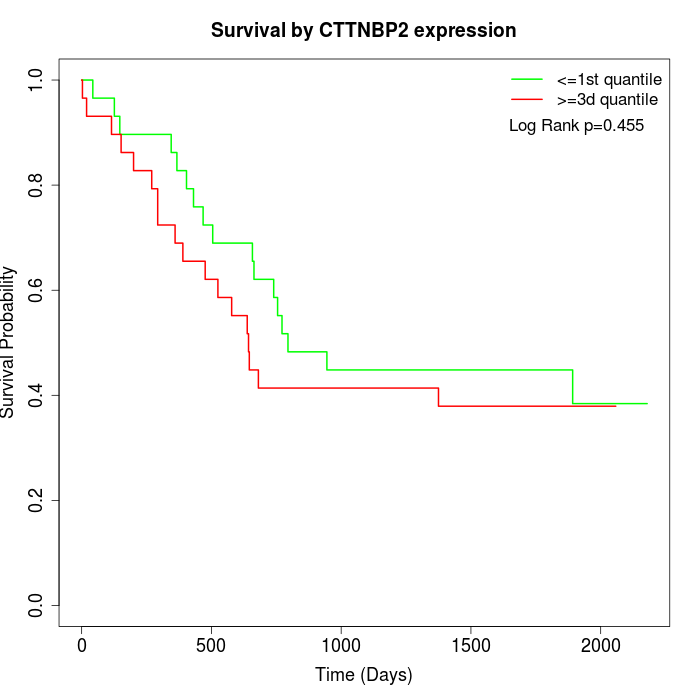 |  |
| GSE53622 | GSE53624 | TCGA |
Note: Click image to view full size file.
Copy number change of CTTNBP2:
| Dataset | Gene | EntrezID | Gain | Loss | Normal | Detail |
|---|---|---|---|---|---|---|
| GSE15526 | CTTNBP2 | 83992 | 8 | 2 | 20 | |
| GSE20123 | CTTNBP2 | 83992 | 9 | 2 | 19 | |
| GSE43470 | CTTNBP2 | 83992 | 4 | 2 | 37 | |
| GSE46452 | CTTNBP2 | 83992 | 8 | 1 | 50 | |
| GSE47630 | CTTNBP2 | 83992 | 7 | 4 | 29 | |
| GSE54993 | CTTNBP2 | 83992 | 2 | 7 | 61 | |
| GSE54994 | CTTNBP2 | 83992 | 12 | 5 | 36 | |
| GSE60625 | CTTNBP2 | 83992 | 0 | 0 | 11 | |
| GSE74703 | CTTNBP2 | 83992 | 4 | 2 | 30 | |
| GSE74704 | CTTNBP2 | 83992 | 6 | 2 | 12 | |
| TCGA | CTTNBP2 | 83992 | 34 | 17 | 45 |
Total number of gains: 94; Total number of losses: 44; Total Number of normals: 350.
Somatic mutations of CTTNBP2:
Generating mutation plots.
Highly correlated genes for CTTNBP2:
Showing top 20/1055 corelated genes with mean PCC>0.5.
| Gene1 | Gene2 | Mean PCC | Num. Datasets | Num. PCC<0 | Num. PCC>0.5 |
|---|---|---|---|---|---|
| CTTNBP2 | MGST2 | 0.859309 | 6 | 0 | 6 |
| CTTNBP2 | SORT1 | 0.859205 | 6 | 0 | 6 |
| CTTNBP2 | FAM3B | 0.859118 | 6 | 0 | 6 |
| CTTNBP2 | CGNL1 | 0.857807 | 6 | 0 | 6 |
| CTTNBP2 | HPGD | 0.857255 | 6 | 0 | 6 |
| CTTNBP2 | SNORA68 | 0.855123 | 4 | 0 | 4 |
| CTTNBP2 | SH3BGRL2 | 0.852135 | 7 | 0 | 7 |
| CTTNBP2 | SAMD5 | 0.851998 | 6 | 0 | 6 |
| CTTNBP2 | MYZAP | 0.851606 | 3 | 0 | 3 |
| CTTNBP2 | SASH1 | 0.850822 | 7 | 0 | 7 |
| CTTNBP2 | GALNT12 | 0.847674 | 6 | 0 | 6 |
| CTTNBP2 | PAQR8 | 0.845999 | 6 | 0 | 6 |
| CTTNBP2 | GPD1L | 0.845945 | 6 | 0 | 6 |
| CTTNBP2 | RRAGD | 0.843906 | 6 | 0 | 6 |
| CTTNBP2 | GYS2 | 0.841024 | 6 | 0 | 6 |
| CTTNBP2 | EPHX2 | 0.834399 | 7 | 0 | 7 |
| CTTNBP2 | ZNF431 | 0.833767 | 4 | 0 | 4 |
| CTTNBP2 | C5orf66-AS1 | 0.83198 | 7 | 0 | 7 |
| CTTNBP2 | FCHO2 | 0.827165 | 6 | 0 | 6 |
| CTTNBP2 | MGLL | 0.826533 | 7 | 0 | 7 |
For details and further investigation, click here