| Full name: sperm acrosome associated 1 | Alias Symbol: SAMP32 | ||
| Type: protein-coding gene | Cytoband: 6q15 | ||
| Entrez ID: 81833 | HGNC ID: HGNC:14967 | Ensembl Gene: ENSG00000118434 | OMIM ID: 612739 |
Expression of SPACA1:
| Dataset | Gene | EntrezID | Probe | Log2FC | Adj.pValue | Expression |
|---|---|---|---|---|---|---|
| GSE17351 | SPACA1 | 81833 | 220982_s_at | -0.0431 | 0.8667 | |
| GSE20347 | SPACA1 | 81833 | 220982_s_at | 0.0327 | 0.6433 | |
| GSE23400 | SPACA1 | 81833 | 220982_s_at | -0.0515 | 0.0902 | |
| GSE26886 | SPACA1 | 81833 | 220982_s_at | -0.1926 | 0.0669 | |
| GSE29001 | SPACA1 | 81833 | 220982_s_at | 0.1026 | 0.6138 | |
| GSE38129 | SPACA1 | 81833 | 220982_s_at | -0.0474 | 0.4566 | |
| GSE45670 | SPACA1 | 81833 | 220982_s_at | 0.0592 | 0.4849 | |
| GSE53622 | SPACA1 | 81833 | 49775 | -0.0456 | 0.7483 | |
| GSE53624 | SPACA1 | 81833 | 49775 | -0.2028 | 0.1284 | |
| GSE63941 | SPACA1 | 81833 | 220982_s_at | -0.0165 | 0.9179 | |
| GSE77861 | SPACA1 | 81833 | 220982_s_at | -0.0831 | 0.2605 | |
| GSE97050 | SPACA1 | 81833 | A_23_P30649 | 0.1362 | 0.5904 |
Upregulated datasets: 0; Downregulated datasets: 0.
Survival by SPACA1 expression:
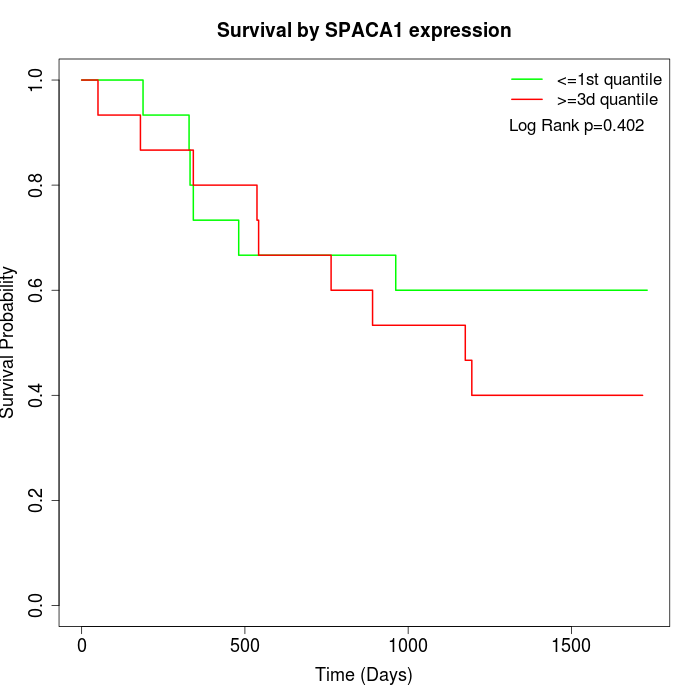 | 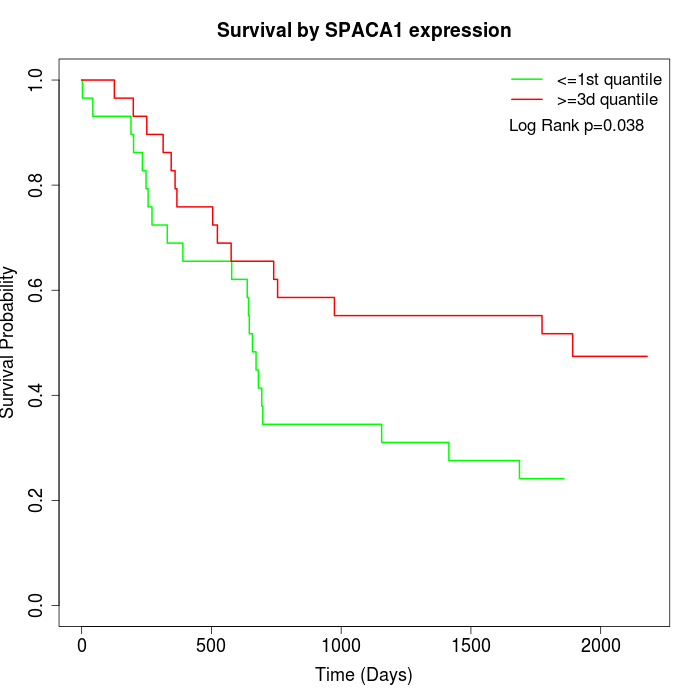 | 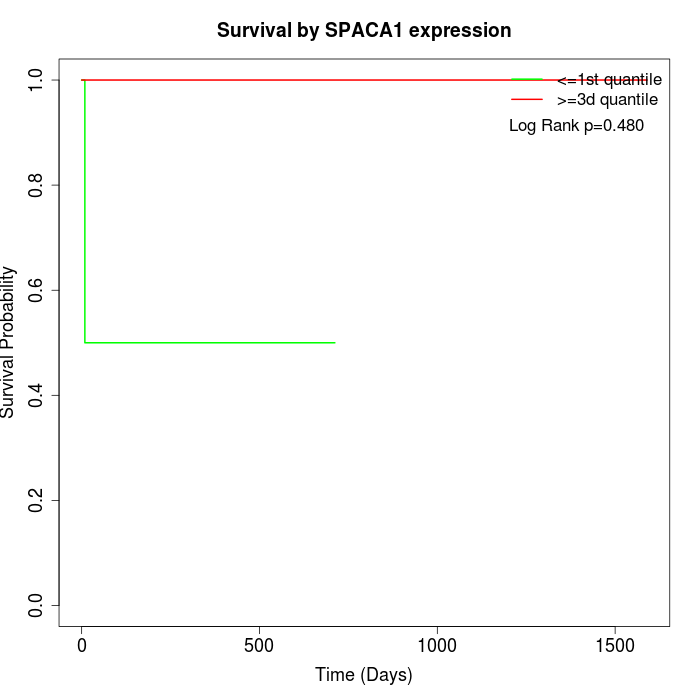 |
| GSE53622 | GSE53624 | TCGA |
Note: Click image to view full size file.
Copy number change of SPACA1:
| Dataset | Gene | EntrezID | Gain | Loss | Normal | Detail |
|---|---|---|---|---|---|---|
| GSE15526 | SPACA1 | 81833 | 1 | 4 | 25 | |
| GSE20123 | SPACA1 | 81833 | 1 | 3 | 26 | |
| GSE43470 | SPACA1 | 81833 | 3 | 1 | 39 | |
| GSE46452 | SPACA1 | 81833 | 2 | 11 | 46 | |
| GSE47630 | SPACA1 | 81833 | 8 | 6 | 26 | |
| GSE54993 | SPACA1 | 81833 | 3 | 2 | 65 | |
| GSE54994 | SPACA1 | 81833 | 8 | 8 | 37 | |
| GSE60625 | SPACA1 | 81833 | 0 | 1 | 10 | |
| GSE74703 | SPACA1 | 81833 | 3 | 1 | 32 | |
| GSE74704 | SPACA1 | 81833 | 0 | 2 | 18 | |
| TCGA | SPACA1 | 81833 | 5 | 21 | 70 |
Total number of gains: 34; Total number of losses: 60; Total Number of normals: 394.
Somatic mutations of SPACA1:
Generating mutation plots.
Highly correlated genes for SPACA1:
Showing top 20/715 corelated genes with mean PCC>0.5.
| Gene1 | Gene2 | Mean PCC | Num. Datasets | Num. PCC<0 | Num. PCC>0.5 |
|---|---|---|---|---|---|
| SPACA1 | CLCNKA | 0.80566 | 3 | 0 | 3 |
| SPACA1 | NOG | 0.788709 | 3 | 0 | 3 |
| SPACA1 | KCNA7 | 0.756088 | 3 | 0 | 3 |
| SPACA1 | TMEM229A | 0.753379 | 3 | 0 | 3 |
| SPACA1 | MAGEL2 | 0.733005 | 4 | 0 | 3 |
| SPACA1 | KRT74 | 0.724892 | 3 | 0 | 3 |
| SPACA1 | TMEM108 | 0.72153 | 3 | 0 | 3 |
| SPACA1 | BTBD19 | 0.720076 | 3 | 0 | 3 |
| SPACA1 | TSKS | 0.716279 | 3 | 0 | 3 |
| SPACA1 | POLM | 0.710852 | 3 | 0 | 3 |
| SPACA1 | DIO3 | 0.704409 | 3 | 0 | 3 |
| SPACA1 | RNF123 | 0.704094 | 3 | 0 | 3 |
| SPACA1 | DCAF12L2 | 0.690251 | 3 | 0 | 3 |
| SPACA1 | CIB3 | 0.689688 | 3 | 0 | 3 |
| SPACA1 | ASRGL1 | 0.687597 | 3 | 0 | 3 |
| SPACA1 | LRRIQ3 | 0.687029 | 3 | 0 | 3 |
| SPACA1 | USH1C | 0.678231 | 8 | 0 | 7 |
| SPACA1 | GPR32 | 0.677956 | 5 | 0 | 3 |
| SPACA1 | FAM171A2 | 0.677915 | 3 | 0 | 3 |
| SPACA1 | PTK2B | 0.675081 | 3 | 0 | 3 |
For details and further investigation, click here