| Full name: sperm flagellar 1 | Alias Symbol: DKFZP434I114|SPEF1A|CLAMP | ||
| Type: protein-coding gene | Cytoband: 20p13 | ||
| Entrez ID: 25876 | HGNC ID: HGNC:15874 | Ensembl Gene: ENSG00000101222 | OMIM ID: 610674 |
Expression of SPEF1:
| Dataset | Gene | EntrezID | Probe | Log2FC | Adj.pValue | Expression |
|---|---|---|---|---|---|---|
| GSE17351 | SPEF1 | 25876 | 216119_s_at | 0.1365 | 0.5294 | |
| GSE20347 | SPEF1 | 25876 | 216119_s_at | 0.0415 | 0.6315 | |
| GSE23400 | SPEF1 | 25876 | 216119_s_at | -0.1177 | 0.0001 | |
| GSE26886 | SPEF1 | 25876 | 216119_s_at | 0.2145 | 0.0470 | |
| GSE29001 | SPEF1 | 25876 | 216119_s_at | 0.0553 | 0.7697 | |
| GSE38129 | SPEF1 | 25876 | 216119_s_at | -0.0048 | 0.9633 | |
| GSE45670 | SPEF1 | 25876 | 216119_s_at | -0.0051 | 0.9620 | |
| GSE53622 | SPEF1 | 25876 | 62394 | 0.0874 | 0.2820 | |
| GSE53624 | SPEF1 | 25876 | 62394 | 0.2911 | 0.0087 | |
| GSE63941 | SPEF1 | 25876 | 216119_s_at | 0.3076 | 0.0704 | |
| GSE77861 | SPEF1 | 25876 | 216119_s_at | 0.0047 | 0.9785 | |
| GSE97050 | SPEF1 | 25876 | A_33_P3314643 | -0.2891 | 0.2841 | |
| TCGA | SPEF1 | 25876 | RNAseq | 0.6116 | 0.2808 |
Upregulated datasets: 0; Downregulated datasets: 0.
Survival by SPEF1 expression:
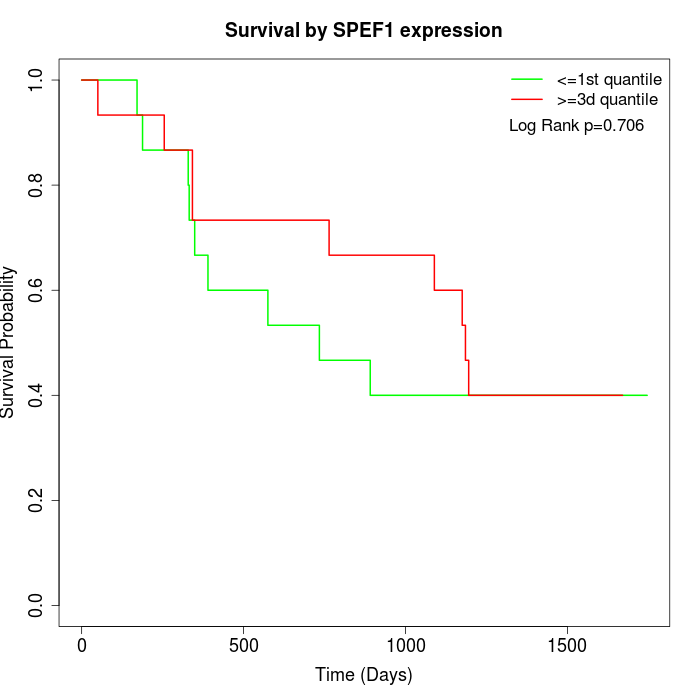 | 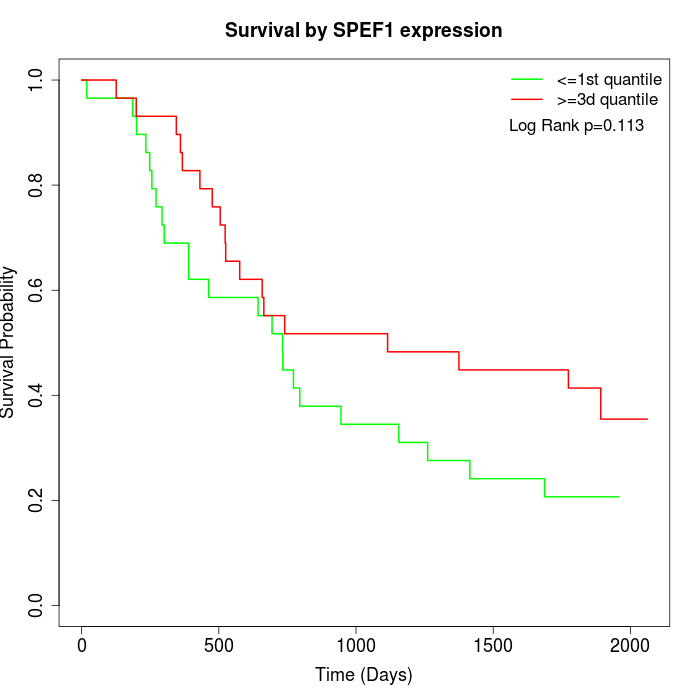 | 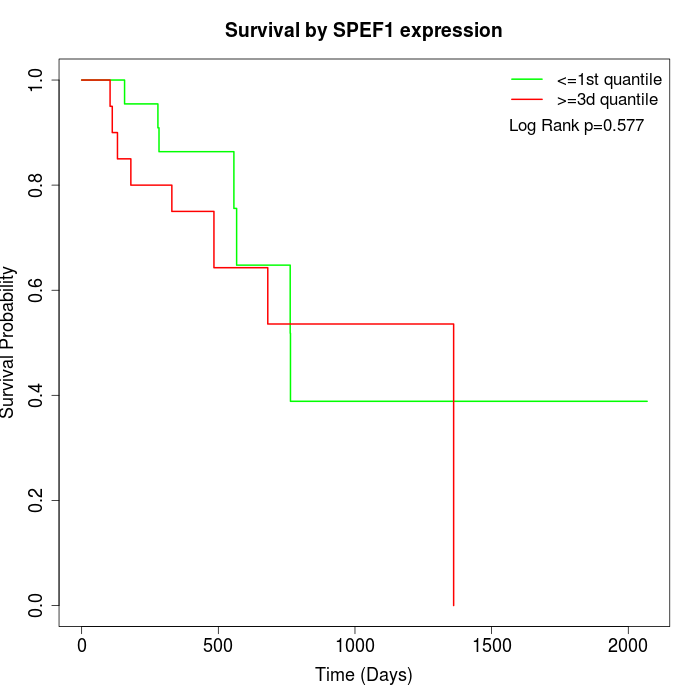 |
| GSE53622 | GSE53624 | TCGA |
Note: Click image to view full size file.
Copy number change of SPEF1:
| Dataset | Gene | EntrezID | Gain | Loss | Normal | Detail |
|---|---|---|---|---|---|---|
| GSE15526 | SPEF1 | 25876 | 12 | 3 | 15 | |
| GSE20123 | SPEF1 | 25876 | 13 | 3 | 14 | |
| GSE43470 | SPEF1 | 25876 | 10 | 1 | 32 | |
| GSE46452 | SPEF1 | 25876 | 26 | 1 | 32 | |
| GSE47630 | SPEF1 | 25876 | 18 | 4 | 18 | |
| GSE54993 | SPEF1 | 25876 | 2 | 14 | 54 | |
| GSE54994 | SPEF1 | 25876 | 22 | 3 | 28 | |
| GSE60625 | SPEF1 | 25876 | 0 | 0 | 11 | |
| GSE74703 | SPEF1 | 25876 | 9 | 1 | 26 | |
| GSE74704 | SPEF1 | 25876 | 8 | 1 | 11 | |
| TCGA | SPEF1 | 25876 | 39 | 11 | 46 |
Total number of gains: 159; Total number of losses: 42; Total Number of normals: 287.
Somatic mutations of SPEF1:
Generating mutation plots.
Highly correlated genes for SPEF1:
Showing top 20/752 corelated genes with mean PCC>0.5.
| Gene1 | Gene2 | Mean PCC | Num. Datasets | Num. PCC<0 | Num. PCC>0.5 |
|---|---|---|---|---|---|
| SPEF1 | TMEM179 | 0.774747 | 3 | 0 | 3 |
| SPEF1 | CSH2 | 0.769922 | 3 | 0 | 3 |
| SPEF1 | SMOC1 | 0.752266 | 3 | 0 | 3 |
| SPEF1 | GYPE | 0.752122 | 3 | 0 | 3 |
| SPEF1 | ZKSCAN2 | 0.749247 | 3 | 0 | 3 |
| SPEF1 | KLHL35 | 0.741815 | 3 | 0 | 3 |
| SPEF1 | STRC | 0.721876 | 3 | 0 | 3 |
| SPEF1 | WDR87 | 0.714147 | 3 | 0 | 3 |
| SPEF1 | DEFB121 | 0.713309 | 3 | 0 | 3 |
| SPEF1 | OR2A5 | 0.711401 | 3 | 0 | 3 |
| SPEF1 | IL1F10 | 0.710061 | 3 | 0 | 3 |
| SPEF1 | GPBAR1 | 0.706588 | 3 | 0 | 3 |
| SPEF1 | PLA2G2C | 0.704662 | 3 | 0 | 3 |
| SPEF1 | DCDC1 | 0.703281 | 3 | 0 | 3 |
| SPEF1 | SNED1 | 0.701972 | 3 | 0 | 3 |
| SPEF1 | FAM71A | 0.700623 | 4 | 0 | 3 |
| SPEF1 | ZIC1 | 0.697495 | 3 | 0 | 3 |
| SPEF1 | OR10C1 | 0.692952 | 5 | 0 | 5 |
| SPEF1 | RAD54L2 | 0.690467 | 3 | 0 | 3 |
| SPEF1 | CACNA1A | 0.686079 | 4 | 0 | 4 |
For details and further investigation, click here