| Full name: taste 2 receptor member 13 | Alias Symbol: T2R13|TRB3 | ||
| Type: protein-coding gene | Cytoband: 12p13 | ||
| Entrez ID: 50838 | HGNC ID: HGNC:14919 | Ensembl Gene: ENSG00000212128 | OMIM ID: 604792 |
Expression of TAS2R13:
| Dataset | Gene | EntrezID | Probe | Log2FC | Adj.pValue | Expression |
|---|---|---|---|---|---|---|
| GSE17351 | TAS2R13 | 50838 | 221395_at | 0.0122 | 0.9638 | |
| GSE20347 | TAS2R13 | 50838 | 221395_at | 0.0472 | 0.4159 | |
| GSE23400 | TAS2R13 | 50838 | 221395_at | -0.1054 | 0.0079 | |
| GSE26886 | TAS2R13 | 50838 | 221395_at | 0.0548 | 0.6430 | |
| GSE29001 | TAS2R13 | 50838 | 221395_at | 0.0039 | 0.9841 | |
| GSE38129 | TAS2R13 | 50838 | 221395_at | 0.0116 | 0.8460 | |
| GSE45670 | TAS2R13 | 50838 | 221395_at | 0.0714 | 0.4161 | |
| GSE53622 | TAS2R13 | 50838 | 99446 | 0.8083 | 0.0000 | |
| GSE53624 | TAS2R13 | 50838 | 99446 | 0.3214 | 0.0016 | |
| GSE63941 | TAS2R13 | 50838 | 221395_at | -0.0709 | 0.6145 | |
| GSE77861 | TAS2R13 | 50838 | 221395_at | 0.0224 | 0.7583 | |
| GSE97050 | TAS2R13 | 50838 | A_23_P99080 | -0.0047 | 0.9868 | |
| SRP133303 | TAS2R13 | 50838 | RNAseq | 0.3366 | 0.2465 | |
| TCGA | TAS2R13 | 50838 | RNAseq | -0.1115 | 0.8566 |
Upregulated datasets: 0; Downregulated datasets: 0.
Survival by TAS2R13 expression:
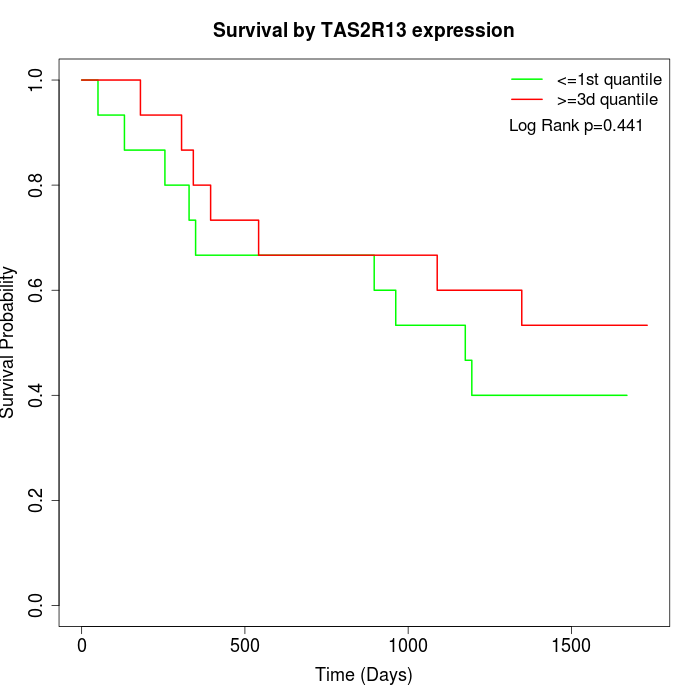 | 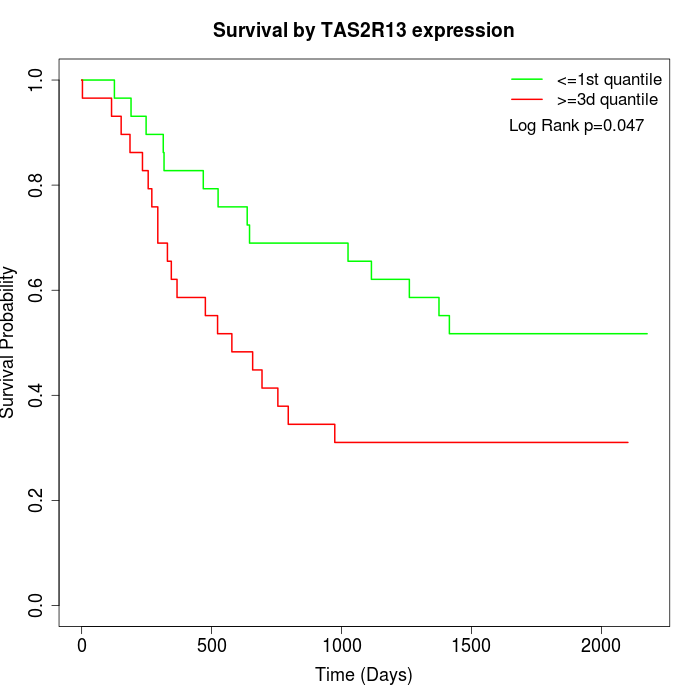 | 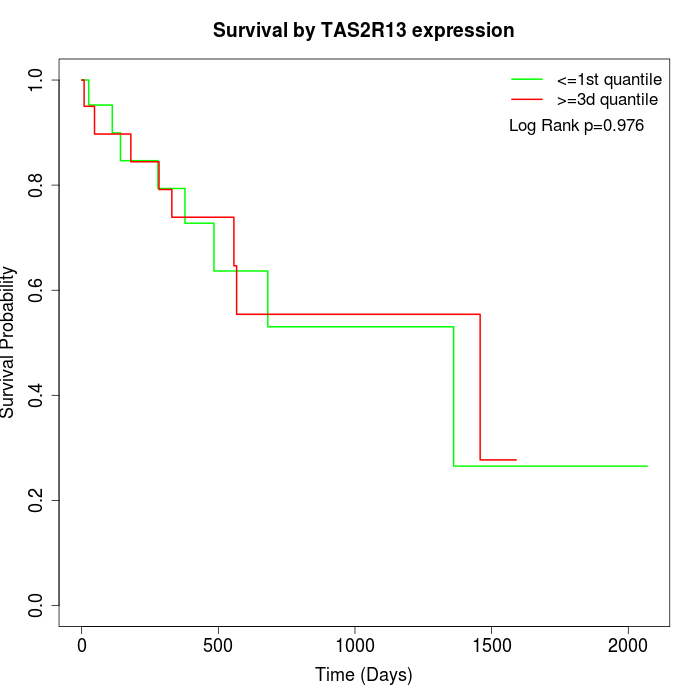 |
| GSE53622 | GSE53624 | TCGA |
Note: Click image to view full size file.
Copy number change of TAS2R13:
| Dataset | Gene | EntrezID | Gain | Loss | Normal | Detail |
|---|---|---|---|---|---|---|
| GSE15526 | TAS2R13 | 50838 | 6 | 2 | 22 | |
| GSE20123 | TAS2R13 | 50838 | 6 | 2 | 22 | |
| GSE43470 | TAS2R13 | 50838 | 9 | 3 | 31 | |
| GSE46452 | TAS2R13 | 50838 | 10 | 1 | 48 | |
| GSE47630 | TAS2R13 | 50838 | 14 | 2 | 24 | |
| GSE54993 | TAS2R13 | 50838 | 1 | 10 | 59 | |
| GSE54994 | TAS2R13 | 50838 | 9 | 2 | 42 | |
| GSE60625 | TAS2R13 | 50838 | 0 | 1 | 10 | |
| GSE74703 | TAS2R13 | 50838 | 9 | 2 | 25 | |
| GSE74704 | TAS2R13 | 50838 | 4 | 1 | 15 | |
| TCGA | TAS2R13 | 50838 | 37 | 8 | 51 |
Total number of gains: 105; Total number of losses: 34; Total Number of normals: 349.
Somatic mutations of TAS2R13:
Generating mutation plots.
Highly correlated genes for TAS2R13:
Showing top 20/124 corelated genes with mean PCC>0.5.
| Gene1 | Gene2 | Mean PCC | Num. Datasets | Num. PCC<0 | Num. PCC>0.5 |
|---|---|---|---|---|---|
| TAS2R13 | AMELY | 0.738708 | 3 | 0 | 3 |
| TAS2R13 | GABRA5 | 0.718751 | 3 | 0 | 3 |
| TAS2R13 | DPF3 | 0.718037 | 3 | 0 | 3 |
| TAS2R13 | TAS2R19 | 0.68396 | 3 | 0 | 3 |
| TAS2R13 | IFNA7 | 0.676753 | 4 | 0 | 4 |
| TAS2R13 | HOXB1 | 0.668607 | 3 | 0 | 3 |
| TAS2R13 | MKRN3 | 0.649252 | 3 | 0 | 3 |
| TAS2R13 | RFPL2 | 0.634373 | 4 | 0 | 4 |
| TAS2R13 | B3GALT1 | 0.633422 | 3 | 0 | 3 |
| TAS2R13 | OR2J2 | 0.626508 | 3 | 0 | 3 |
| TAS2R13 | OR10J1 | 0.622307 | 5 | 0 | 4 |
| TAS2R13 | RBPJL | 0.610456 | 4 | 0 | 4 |
| TAS2R13 | SLC26A3 | 0.61028 | 5 | 0 | 5 |
| TAS2R13 | DGCR6L | 0.609864 | 3 | 0 | 3 |
| TAS2R13 | EPOR | 0.608337 | 3 | 0 | 3 |
| TAS2R13 | NEUROD2 | 0.606039 | 4 | 0 | 4 |
| TAS2R13 | KRT38 | 0.605952 | 4 | 0 | 3 |
| TAS2R13 | GCK | 0.602572 | 4 | 0 | 3 |
| TAS2R13 | CRP | 0.602429 | 4 | 0 | 3 |
| TAS2R13 | LZTS1 | 0.60234 | 4 | 0 | 3 |
For details and further investigation, click here