| Full name: titin-cap | Alias Symbol: T-cap|TELE|telethonin|CMD1N | ||
| Type: protein-coding gene | Cytoband: 17q12 | ||
| Entrez ID: 8557 | HGNC ID: HGNC:11610 | Ensembl Gene: ENSG00000173991 | OMIM ID: 604488 |
Expression of TCAP:
| Dataset | Gene | EntrezID | Probe | Log2FC | Adj.pValue | Expression |
|---|---|---|---|---|---|---|
| GSE17351 | TCAP | 8557 | 205766_at | 0.0191 | 0.9529 | |
| GSE20347 | TCAP | 8557 | 205766_at | -0.0741 | 0.3644 | |
| GSE23400 | TCAP | 8557 | 205766_at | -0.0728 | 0.2266 | |
| GSE26886 | TCAP | 8557 | 205766_at | 0.2719 | 0.0685 | |
| GSE29001 | TCAP | 8557 | 205766_at | -0.0879 | 0.5644 | |
| GSE38129 | TCAP | 8557 | 205766_at | -0.1168 | 0.0216 | |
| GSE45670 | TCAP | 8557 | 205766_at | 0.0594 | 0.4640 | |
| GSE53622 | TCAP | 8557 | 89549 | 0.4238 | 0.0000 | |
| GSE53624 | TCAP | 8557 | 89549 | 0.4629 | 0.0000 | |
| GSE63941 | TCAP | 8557 | 205766_at | 0.0917 | 0.5723 | |
| GSE77861 | TCAP | 8557 | 205766_at | -0.0379 | 0.8688 | |
| GSE97050 | TCAP | 8557 | A_23_P107051 | -1.7137 | 0.1363 | |
| TCGA | TCAP | 8557 | RNAseq | -1.2817 | 0.0015 |
Upregulated datasets: 0; Downregulated datasets: 1.
Survival by TCAP expression:
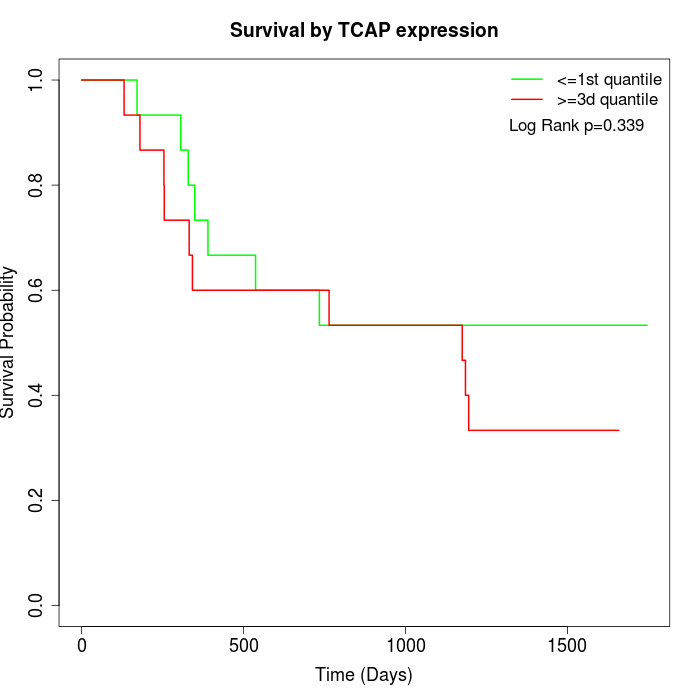 | 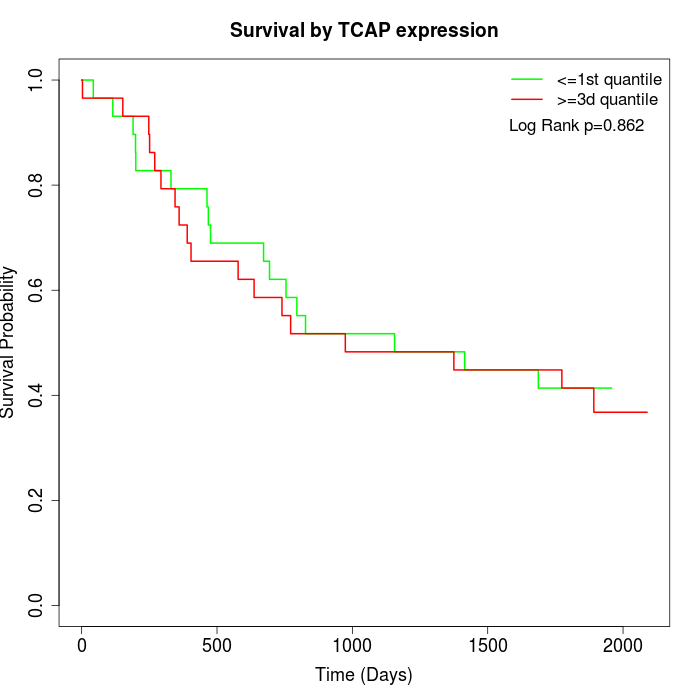 | 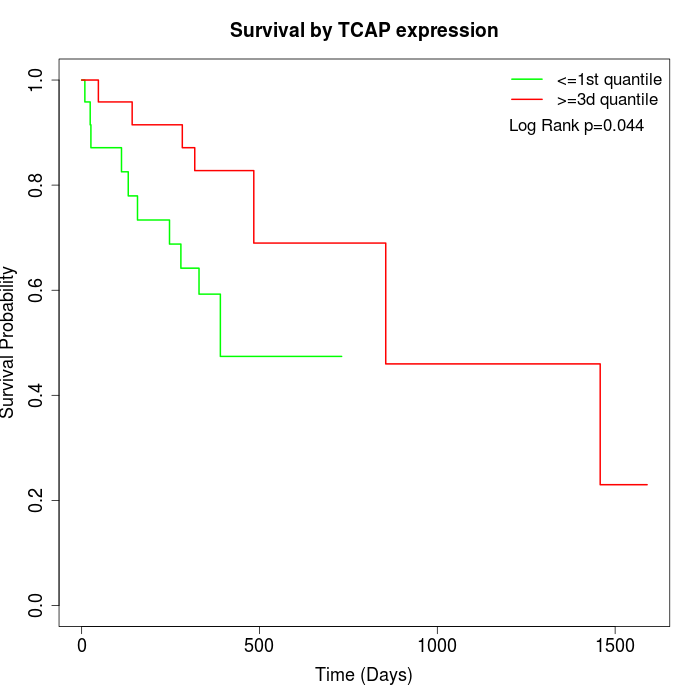 |
| GSE53622 | GSE53624 | TCGA |
Note: Click image to view full size file.
Copy number change of TCAP:
| Dataset | Gene | EntrezID | Gain | Loss | Normal | Detail |
|---|---|---|---|---|---|---|
| GSE15526 | TCAP | 8557 | 8 | 1 | 21 | |
| GSE20123 | TCAP | 8557 | 8 | 1 | 21 | |
| GSE43470 | TCAP | 8557 | 1 | 1 | 41 | |
| GSE46452 | TCAP | 8557 | 34 | 0 | 25 | |
| GSE47630 | TCAP | 8557 | 8 | 1 | 31 | |
| GSE54993 | TCAP | 8557 | 3 | 4 | 63 | |
| GSE54994 | TCAP | 8557 | 9 | 5 | 39 | |
| GSE60625 | TCAP | 8557 | 4 | 0 | 7 | |
| GSE74703 | TCAP | 8557 | 1 | 0 | 35 | |
| GSE74704 | TCAP | 8557 | 5 | 1 | 14 | |
| TCGA | TCAP | 8557 | 23 | 8 | 65 |
Total number of gains: 104; Total number of losses: 22; Total Number of normals: 362.
Somatic mutations of TCAP:
Generating mutation plots.
Highly correlated genes for TCAP:
Showing top 20/513 corelated genes with mean PCC>0.5.
| Gene1 | Gene2 | Mean PCC | Num. Datasets | Num. PCC<0 | Num. PCC>0.5 |
|---|---|---|---|---|---|
| TCAP | CKM | 0.812305 | 4 | 0 | 4 |
| TCAP | DCHS2 | 0.747519 | 3 | 0 | 3 |
| TCAP | PCYT1B | 0.730513 | 3 | 0 | 3 |
| TCAP | FAM43B | 0.72287 | 3 | 0 | 3 |
| TCAP | CCR10 | 0.718792 | 5 | 0 | 5 |
| TCAP | KLHL31 | 0.716216 | 3 | 0 | 3 |
| TCAP | ABHD16B | 0.714981 | 3 | 0 | 3 |
| TCAP | PSD | 0.713892 | 4 | 0 | 4 |
| TCAP | ZNF683 | 0.708617 | 5 | 0 | 5 |
| TCAP | OR1L6 | 0.70577 | 3 | 0 | 3 |
| TCAP | SSC5D | 0.696875 | 4 | 0 | 4 |
| TCAP | EXD3 | 0.688175 | 4 | 0 | 4 |
| TCAP | IQCC | 0.687752 | 5 | 0 | 5 |
| TCAP | ADAD2 | 0.686668 | 3 | 0 | 3 |
| TCAP | SYDE1 | 0.682556 | 3 | 0 | 3 |
| TCAP | MEF2D | 0.681165 | 4 | 0 | 4 |
| TCAP | CYP2B6 | 0.680726 | 3 | 0 | 3 |
| TCAP | ULK4 | 0.675473 | 3 | 0 | 3 |
| TCAP | AVP | 0.674937 | 4 | 0 | 4 |
| TCAP | LGI2 | 0.671705 | 6 | 0 | 5 |
For details and further investigation, click here