| Full name: nuclear factor I A | Alias Symbol: NFI-L|KIAA1439 | ||
| Type: protein-coding gene | Cytoband: 1p31.3 | ||
| Entrez ID: 4774 | HGNC ID: HGNC:7784 | Ensembl Gene: ENSG00000162599 | OMIM ID: 600727 |
Expression of NFIA:
| Dataset | Gene | EntrezID | Probe | Log2FC | Adj.pValue | Expression |
|---|---|---|---|---|---|---|
| GSE17351 | NFIA | 4774 | 224970_at | -0.9810 | 0.1282 | |
| GSE26886 | NFIA | 4774 | 226806_s_at | -0.8787 | 0.0010 | |
| GSE45670 | NFIA | 4774 | 224970_at | -1.3817 | 0.0000 | |
| GSE53622 | NFIA | 4774 | 114825 | -1.8979 | 0.0000 | |
| GSE53624 | NFIA | 4774 | 136432 | -1.8533 | 0.0000 | |
| GSE63941 | NFIA | 4774 | 226806_s_at | -0.1102 | 0.9223 | |
| GSE77861 | NFIA | 4774 | 224970_at | -1.1785 | 0.0003 | |
| GSE97050 | NFIA | 4774 | A_33_P3319625 | -1.3656 | 0.0781 | |
| SRP007169 | NFIA | 4774 | RNAseq | -1.0595 | 0.0069 | |
| SRP008496 | NFIA | 4774 | RNAseq | -0.9814 | 0.0003 | |
| SRP064894 | NFIA | 4774 | RNAseq | -0.7864 | 0.0388 | |
| SRP133303 | NFIA | 4774 | RNAseq | -1.4056 | 0.0000 | |
| SRP159526 | NFIA | 4774 | RNAseq | -1.6140 | 0.0000 | |
| SRP193095 | NFIA | 4774 | RNAseq | -0.9914 | 0.0000 | |
| SRP219564 | NFIA | 4774 | RNAseq | -0.6505 | 0.2489 | |
| TCGA | NFIA | 4774 | RNAseq | -0.3891 | 0.0000 |
Upregulated datasets: 0; Downregulated datasets: 7.
Survival by NFIA expression:
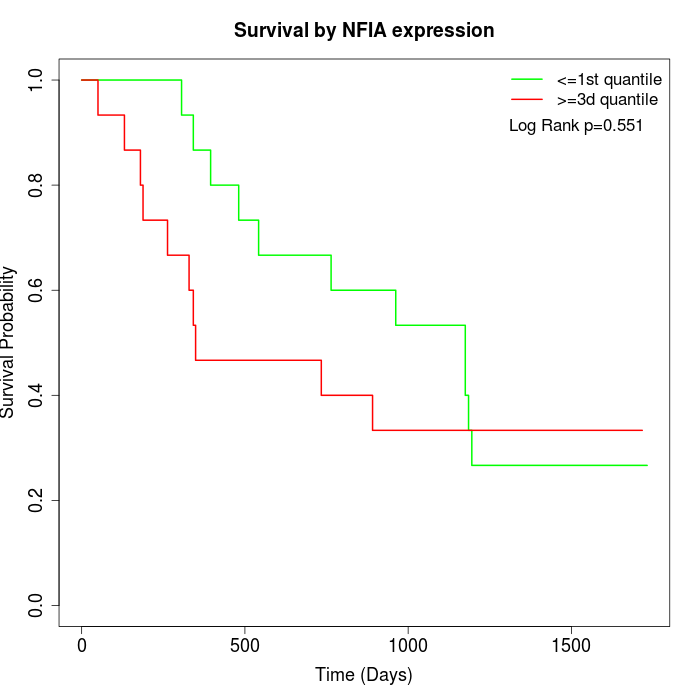 | 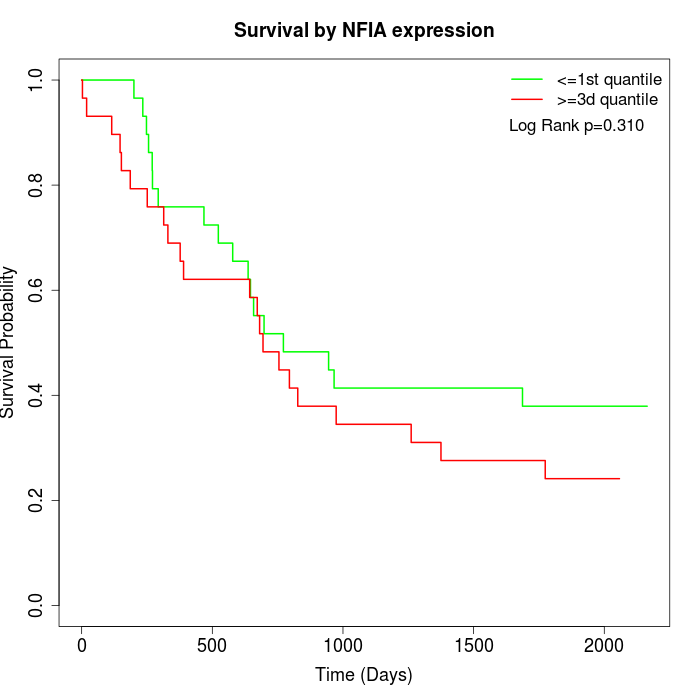 | 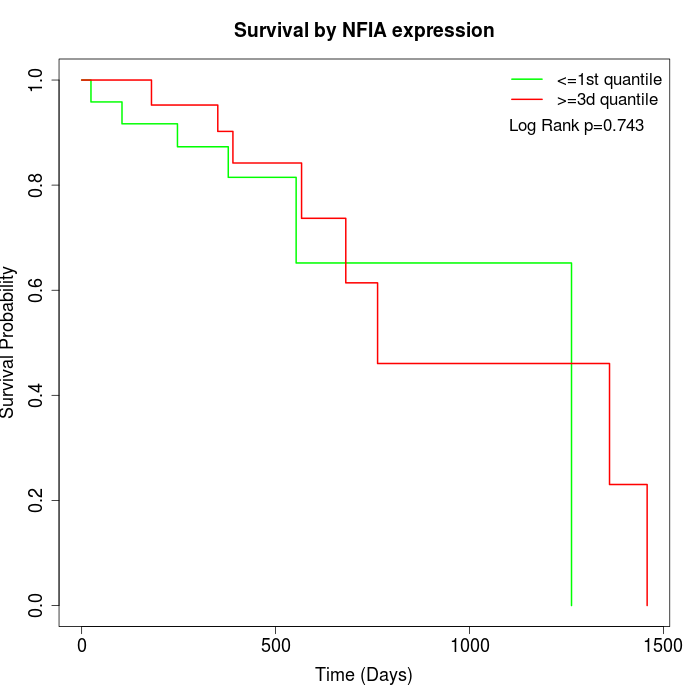 |
| GSE53622 | GSE53624 | TCGA |
Note: Click image to view full size file.
Copy number change of NFIA:
| Dataset | Gene | EntrezID | Gain | Loss | Normal | Detail |
|---|---|---|---|---|---|---|
| GSE15526 | NFIA | 4774 | 3 | 5 | 22 | |
| GSE20123 | NFIA | 4774 | 3 | 4 | 23 | |
| GSE43470 | NFIA | 4774 | 5 | 2 | 36 | |
| GSE46452 | NFIA | 4774 | 2 | 1 | 56 | |
| GSE47630 | NFIA | 4774 | 8 | 5 | 27 | |
| GSE54993 | NFIA | 4774 | 0 | 0 | 70 | |
| GSE54994 | NFIA | 4774 | 6 | 4 | 43 | |
| GSE60625 | NFIA | 4774 | 0 | 0 | 11 | |
| GSE74703 | NFIA | 4774 | 4 | 2 | 30 | |
| GSE74704 | NFIA | 4774 | 2 | 1 | 17 | |
| TCGA | NFIA | 4774 | 10 | 20 | 66 |
Total number of gains: 43; Total number of losses: 44; Total Number of normals: 401.
Somatic mutations of NFIA:
Generating mutation plots.
Highly correlated genes for NFIA:
Showing top 20/1762 corelated genes with mean PCC>0.5.
| Gene1 | Gene2 | Mean PCC | Num. Datasets | Num. PCC<0 | Num. PCC>0.5 |
|---|---|---|---|---|---|
| NFIA | CLEC3B | 0.861517 | 3 | 0 | 3 |
| NFIA | ANGPTL1 | 0.846484 | 5 | 0 | 5 |
| NFIA | MEIS1 | 0.844246 | 7 | 0 | 7 |
| NFIA | NFIX | 0.836908 | 6 | 0 | 6 |
| NFIA | ACOX3 | 0.833978 | 6 | 0 | 6 |
| NFIA | CYP21A2 | 0.826208 | 3 | 0 | 3 |
| NFIA | GPD1L | 0.822569 | 7 | 0 | 7 |
| NFIA | GRHPR | 0.813771 | 3 | 0 | 3 |
| NFIA | PCP4 | 0.809623 | 5 | 0 | 5 |
| NFIA | CASQ2 | 0.805083 | 5 | 0 | 5 |
| NFIA | XKR4 | 0.799654 | 5 | 0 | 5 |
| NFIA | ARHGEF10L | 0.798323 | 7 | 0 | 7 |
| NFIA | ZNF844 | 0.79699 | 6 | 0 | 6 |
| NFIA | CAB39L | 0.79009 | 7 | 0 | 7 |
| NFIA | PDK4 | 0.789776 | 4 | 0 | 4 |
| NFIA | NPY1R | 0.789594 | 3 | 0 | 3 |
| NFIA | SORBS2 | 0.787427 | 7 | 0 | 7 |
| NFIA | CHRDL1 | 0.782441 | 4 | 0 | 4 |
| NFIA | HDHD2 | 0.781049 | 5 | 0 | 5 |
| NFIA | GFRA1 | 0.780528 | 5 | 0 | 5 |
For details and further investigation, click here