| Full name: TLE family member 2, transcriptional corepressor | Alias Symbol: ESG2|GRG2|ESG|FLJ41188 | ||
| Type: protein-coding gene | Cytoband: 19p13.3 | ||
| Entrez ID: 7089 | HGNC ID: HGNC:11838 | Ensembl Gene: ENSG00000065717 | OMIM ID: 601041 |
Expression of TLE2:
| Dataset | Gene | EntrezID | Probe | Log2FC | Adj.pValue | Expression |
|---|---|---|---|---|---|---|
| GSE17351 | TLE2 | 7089 | 40837_at | -0.8694 | 0.1613 | |
| GSE20347 | TLE2 | 7089 | 40837_at | -0.3377 | 0.1030 | |
| GSE23400 | TLE2 | 7089 | 40837_at | -0.3518 | 0.0000 | |
| GSE26886 | TLE2 | 7089 | 40837_at | 0.2997 | 0.3790 | |
| GSE29001 | TLE2 | 7089 | 40837_at | -0.6344 | 0.0082 | |
| GSE38129 | TLE2 | 7089 | 40837_at | -0.5403 | 0.0026 | |
| GSE45670 | TLE2 | 7089 | 40837_at | -0.8004 | 0.0006 | |
| GSE63941 | TLE2 | 7089 | 40837_at | 0.5759 | 0.2734 | |
| GSE77861 | TLE2 | 7089 | 40837_at | -0.5527 | 0.0045 | |
| GSE97050 | TLE2 | 7089 | A_23_P153676 | -0.5239 | 0.1965 | |
| SRP064894 | TLE2 | 7089 | RNAseq | -0.5532 | 0.1785 | |
| SRP133303 | TLE2 | 7089 | RNAseq | -0.8413 | 0.0039 | |
| SRP159526 | TLE2 | 7089 | RNAseq | -0.2542 | 0.6380 | |
| SRP193095 | TLE2 | 7089 | RNAseq | -0.2624 | 0.1719 | |
| SRP219564 | TLE2 | 7089 | RNAseq | -0.5903 | 0.3882 | |
| TCGA | TLE2 | 7089 | RNAseq | -0.6834 | 0.0002 |
Upregulated datasets: 0; Downregulated datasets: 0.
Survival by TLE2 expression:
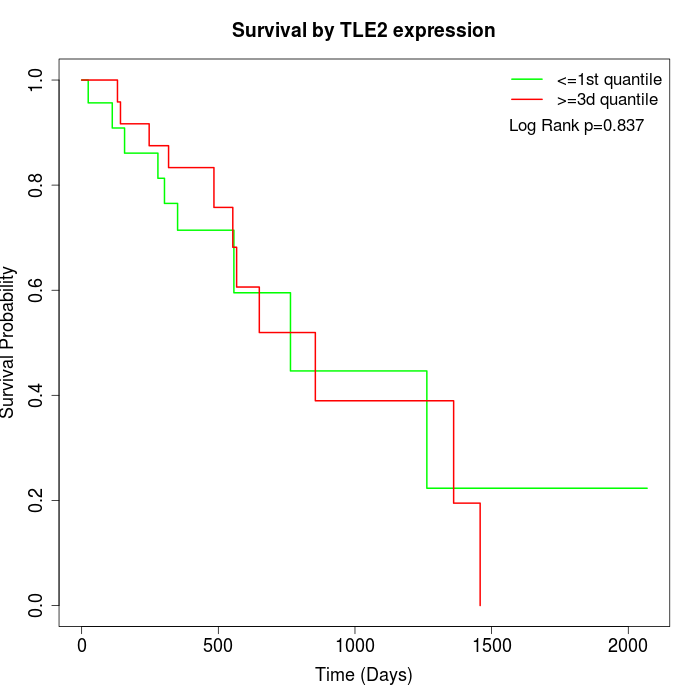 |
| TCGA |
Note: Click image to view full size file.
Copy number change of TLE2:
| Dataset | Gene | EntrezID | Gain | Loss | Normal | Detail |
|---|---|---|---|---|---|---|
| GSE15526 | TLE2 | 7089 | 4 | 4 | 22 | |
| GSE20123 | TLE2 | 7089 | 3 | 4 | 23 | |
| GSE43470 | TLE2 | 7089 | 1 | 9 | 33 | |
| GSE46452 | TLE2 | 7089 | 47 | 1 | 11 | |
| GSE47630 | TLE2 | 7089 | 5 | 7 | 28 | |
| GSE54993 | TLE2 | 7089 | 16 | 3 | 51 | |
| GSE54994 | TLE2 | 7089 | 8 | 16 | 29 | |
| GSE60625 | TLE2 | 7089 | 9 | 0 | 2 | |
| GSE74703 | TLE2 | 7089 | 1 | 6 | 29 | |
| GSE74704 | TLE2 | 7089 | 1 | 3 | 16 | |
| TCGA | TLE2 | 7089 | 8 | 22 | 66 |
Total number of gains: 103; Total number of losses: 75; Total Number of normals: 310.
Somatic mutations of TLE2:
Generating mutation plots.
Highly correlated genes for TLE2:
Showing top 20/811 corelated genes with mean PCC>0.5.
| Gene1 | Gene2 | Mean PCC | Num. Datasets | Num. PCC<0 | Num. PCC>0.5 |
|---|---|---|---|---|---|
| TLE2 | RRAGA | 0.824209 | 3 | 0 | 3 |
| TLE2 | GRHPR | 0.779697 | 3 | 0 | 3 |
| TLE2 | KCNT2 | 0.771704 | 4 | 0 | 4 |
| TLE2 | ABHD14B | 0.768909 | 4 | 0 | 4 |
| TLE2 | RECK | 0.760209 | 3 | 0 | 3 |
| TLE2 | ACTR1A | 0.752519 | 3 | 0 | 3 |
| TLE2 | ZNF175 | 0.751044 | 3 | 0 | 3 |
| TLE2 | FBXW5 | 0.749102 | 3 | 0 | 3 |
| TLE2 | AFF3 | 0.748965 | 3 | 0 | 3 |
| TLE2 | IDH3G | 0.744317 | 3 | 0 | 3 |
| TLE2 | ENPP5 | 0.741524 | 3 | 0 | 3 |
| TLE2 | ICA1L | 0.736182 | 4 | 0 | 4 |
| TLE2 | CCDC3 | 0.733475 | 3 | 0 | 3 |
| TLE2 | EIF4E3 | 0.730252 | 4 | 0 | 4 |
| TLE2 | CCDC174 | 0.729904 | 3 | 0 | 3 |
| TLE2 | RASD2 | 0.72938 | 3 | 0 | 3 |
| TLE2 | C10orf82 | 0.728955 | 3 | 0 | 3 |
| TLE2 | RERG | 0.726003 | 4 | 0 | 3 |
| TLE2 | NLRP12 | 0.725832 | 3 | 0 | 3 |
| TLE2 | TCEA3 | 0.724671 | 4 | 0 | 3 |
For details and further investigation, click here