| Full name: trichohyalin | Alias Symbol: | ||
| Type: protein-coding gene | Cytoband: 1q21.3 | ||
| Entrez ID: 7062 | HGNC ID: HGNC:11791 | Ensembl Gene: ENSG00000159450 | OMIM ID: 190370 |
| Drug and gene relationship at DGIdb | |||
Expression of TCHH:
| Dataset | Gene | EntrezID | Probe | Log2FC | Adj.pValue | Expression |
|---|---|---|---|---|---|---|
| GSE17351 | TCHH | 7062 | 213780_at | 2.1065 | 0.4249 | |
| GSE20347 | TCHH | 7062 | 213780_at | 1.0671 | 0.0734 | |
| GSE23400 | TCHH | 7062 | 213780_at | 0.2500 | 0.0139 | |
| GSE26886 | TCHH | 7062 | 213780_at | 1.4228 | 0.0282 | |
| GSE29001 | TCHH | 7062 | 213780_at | 1.7900 | 0.0025 | |
| GSE38129 | TCHH | 7062 | 213780_at | 0.5131 | 0.2758 | |
| GSE45670 | TCHH | 7062 | 213780_at | 1.7518 | 0.0022 | |
| GSE53622 | TCHH | 7062 | 12792 | 1.0367 | 0.0000 | |
| GSE53624 | TCHH | 7062 | 12792 | 1.0438 | 0.0000 | |
| GSE63941 | TCHH | 7062 | 213780_at | 0.7809 | 0.3652 | |
| GSE77861 | TCHH | 7062 | 213780_at | 2.7714 | 0.0264 | |
| GSE97050 | TCHH | 7062 | A_33_P3381684 | 0.7352 | 0.3784 | |
| SRP133303 | TCHH | 7062 | RNAseq | 4.5267 | 0.0000 | |
| SRP159526 | TCHH | 7062 | RNAseq | 1.4811 | 0.0000 | |
| SRP219564 | TCHH | 7062 | RNAseq | 0.6670 | 0.2553 | |
| TCGA | TCHH | 7062 | RNAseq | 2.4857 | 0.0000 |
Upregulated datasets: 9; Downregulated datasets: 0.
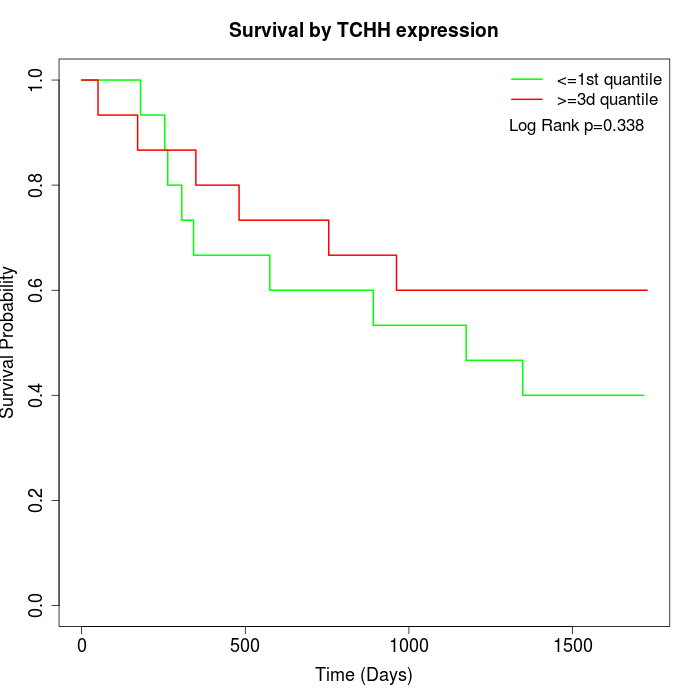
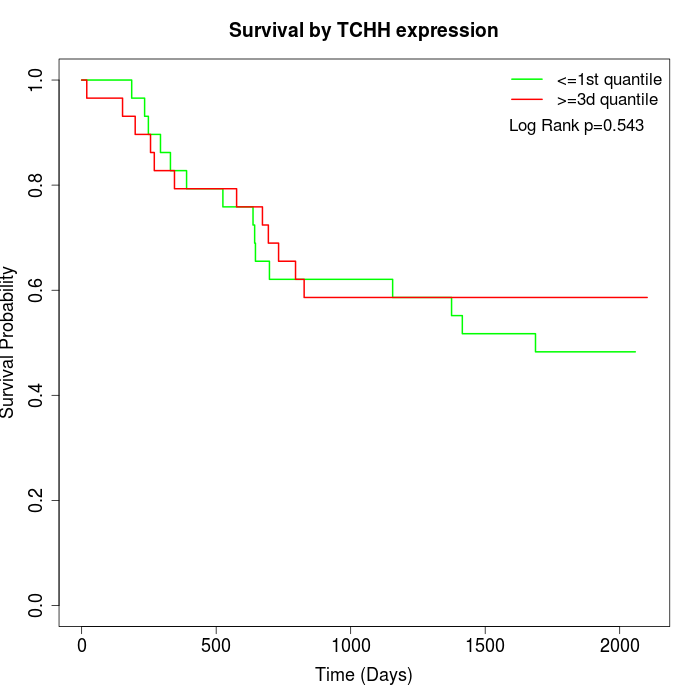
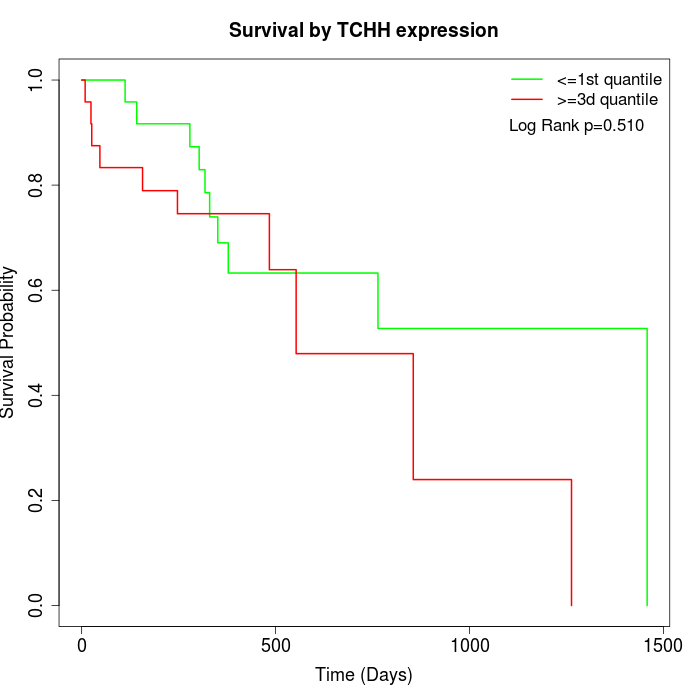
Survival by TCHH expression:
Note: Click image to view full size file.
Copy number change of TCHH:
| Dataset | Gene | EntrezID | Gain | Loss | Normal | Detail |
|---|---|---|---|---|---|---|
| GSE15526 | TCHH | 7062 | 15 | 0 | 15 | |
| GSE20123 | TCHH | 7062 | 15 | 0 | 15 | |
| GSE43470 | TCHH | 7062 | 6 | 2 | 35 | |
| GSE46452 | TCHH | 7062 | 2 | 1 | 56 | |
| GSE47630 | TCHH | 7062 | 15 | 0 | 25 | |
| GSE54993 | TCHH | 7062 | 0 | 4 | 66 | |
| GSE54994 | TCHH | 7062 | 15 | 0 | 38 | |
| GSE60625 | TCHH | 7062 | 0 | 0 | 11 | |
| GSE74703 | TCHH | 7062 | 6 | 1 | 29 | |
| GSE74704 | TCHH | 7062 | 7 | 0 | 13 | |
| TCGA | TCHH | 7062 | 39 | 2 | 55 |
Total number of gains: 120; Total number of losses: 10; Total Number of normals: 358.
Somatic mutations of TCHH:
Generating mutation plots.
Highly correlated genes for TCHH:
Showing top 20/148 corelated genes with mean PCC>0.5.
| Gene1 | Gene2 | Mean PCC | Num. Datasets | Num. PCC<0 | Num. PCC>0.5 |
|---|---|---|---|---|---|
| TCHH | GGT7 | 0.748503 | 3 | 0 | 3 |
| TCHH | LTB4R | 0.727654 | 3 | 0 | 3 |
| TCHH | NPW | 0.72419 | 4 | 0 | 3 |
| TCHH | ZNF622 | 0.705124 | 3 | 0 | 3 |
| TCHH | ZBED8 | 0.680109 | 3 | 0 | 3 |
| TCHH | TTC5 | 0.678345 | 4 | 0 | 3 |
| TCHH | IGSF9 | 0.667375 | 3 | 0 | 3 |
| TCHH | PLEKHA1 | 0.666478 | 3 | 0 | 3 |
| TCHH | CCDC43 | 0.666302 | 3 | 0 | 3 |
| TCHH | PRPF6 | 0.662763 | 3 | 0 | 3 |
| TCHH | ELOVL3 | 0.646688 | 4 | 0 | 3 |
| TCHH | RWDD3 | 0.644758 | 3 | 0 | 3 |
| TCHH | FAM131A | 0.642501 | 3 | 0 | 3 |
| TCHH | PSMA7 | 0.632857 | 3 | 0 | 3 |
| TCHH | TTC30A | 0.621771 | 4 | 0 | 3 |
| TCHH | GNPNAT1 | 0.619971 | 3 | 0 | 3 |
| TCHH | ATG4D | 0.618783 | 4 | 0 | 3 |
| TCHH | PAPOLA | 0.617888 | 4 | 0 | 3 |
| TCHH | AMDHD1 | 0.616618 | 4 | 0 | 3 |
| TCHH | ARID3A | 0.615824 | 3 | 0 | 3 |
For details and further investigation, click here


