| Full name: trefoil factor 3 | Alias Symbol: HITF|ITF | ||
| Type: protein-coding gene | Cytoband: 21q22.3 | ||
| Entrez ID: 7033 | HGNC ID: HGNC:11757 | Ensembl Gene: ENSG00000160180 | OMIM ID: 600633 |
| Related drugs: AMINOGLUTETHIMIDE, TAMOXIFEN... [more] | |||
Expression of TFF3:
| Dataset | Gene | EntrezID | Probe | Log2FC | Adj.pValue | Expression |
|---|---|---|---|---|---|---|
| GSE17351 | TFF3 | 7033 | 204623_at | -1.8575 | 0.1942 | |
| GSE20347 | TFF3 | 7033 | 204623_at | -0.0029 | 0.9911 | |
| GSE23400 | TFF3 | 7033 | 204623_at | -1.1454 | 0.0000 | |
| GSE26886 | TFF3 | 7033 | 204623_at | 0.3381 | 0.0534 | |
| GSE29001 | TFF3 | 7033 | 204623_at | 0.0104 | 0.9691 | |
| GSE38129 | TFF3 | 7033 | 204623_at | -0.3413 | 0.2626 | |
| GSE45670 | TFF3 | 7033 | 204623_at | -1.5448 | 0.0052 | |
| GSE53622 | TFF3 | 7033 | 4270 | -3.8207 | 0.0000 | |
| GSE53624 | TFF3 | 7033 | 4270 | -3.4617 | 0.0000 | |
| GSE63941 | TFF3 | 7033 | 204623_at | 0.0685 | 0.8976 | |
| GSE77861 | TFF3 | 7033 | 204623_at | -0.0359 | 0.9031 | |
| GSE97050 | TFF3 | 7033 | A_23_P393099 | -1.5092 | 0.1806 | |
| SRP133303 | TFF3 | 7033 | RNAseq | -5.6951 | 0.0000 | |
| SRP159526 | TFF3 | 7033 | RNAseq | -0.9954 | 0.3938 | |
| SRP219564 | TFF3 | 7033 | RNAseq | -1.7719 | 0.0371 | |
| TCGA | TFF3 | 7033 | RNAseq | -1.0863 | 0.0164 |
Upregulated datasets: 0; Downregulated datasets: 7.
Survival by TFF3 expression:
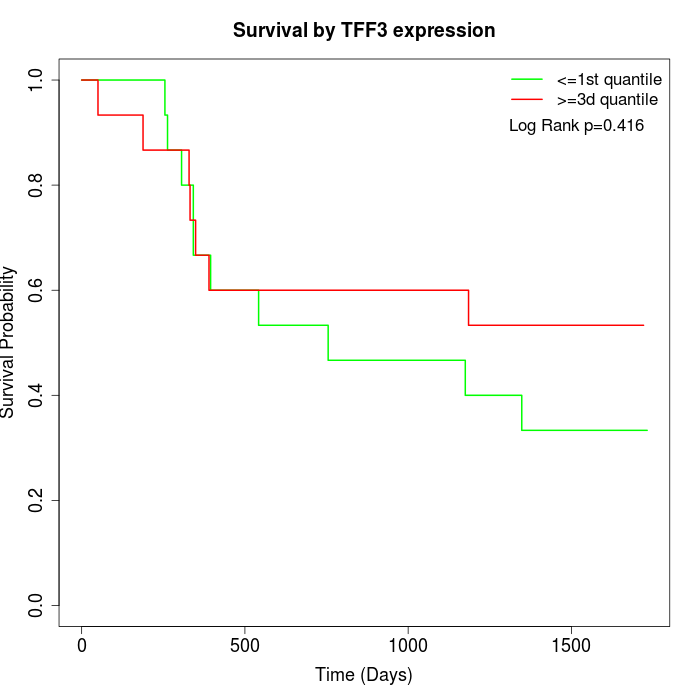 |  | 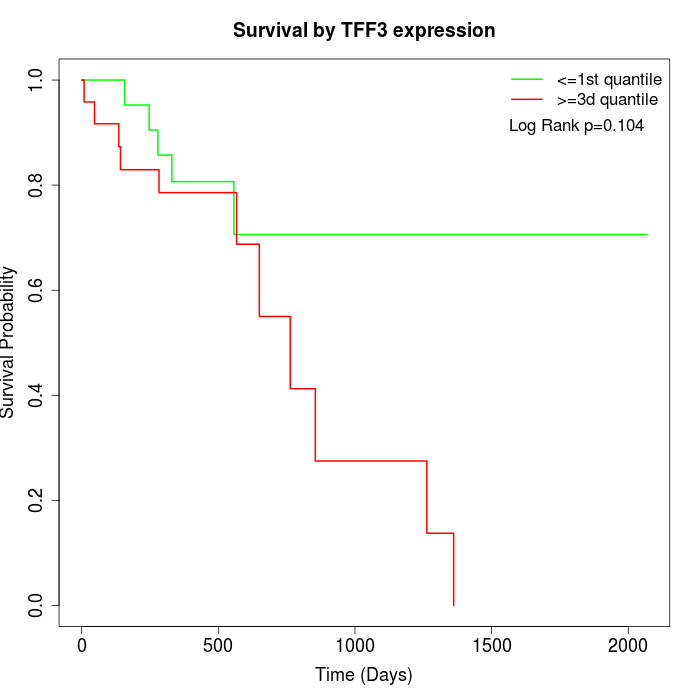 |
| GSE53622 | GSE53624 | TCGA |
Note: Click image to view full size file.
Copy number change of TFF3:
| Dataset | Gene | EntrezID | Gain | Loss | Normal | Detail |
|---|---|---|---|---|---|---|
| GSE15526 | TFF3 | 7033 | 2 | 8 | 20 | |
| GSE20123 | TFF3 | 7033 | 2 | 8 | 20 | |
| GSE43470 | TFF3 | 7033 | 0 | 13 | 30 | |
| GSE46452 | TFF3 | 7033 | 1 | 21 | 37 | |
| GSE47630 | TFF3 | 7033 | 6 | 17 | 17 | |
| GSE54993 | TFF3 | 7033 | 8 | 1 | 61 | |
| GSE54994 | TFF3 | 7033 | 3 | 8 | 42 | |
| GSE60625 | TFF3 | 7033 | 0 | 0 | 11 | |
| GSE74703 | TFF3 | 7033 | 0 | 10 | 26 | |
| GSE74704 | TFF3 | 7033 | 1 | 4 | 15 | |
| TCGA | TFF3 | 7033 | 7 | 41 | 48 |
Total number of gains: 30; Total number of losses: 131; Total Number of normals: 327.
Somatic mutations of TFF3:
Generating mutation plots.
Highly correlated genes for TFF3:
Showing top 20/187 corelated genes with mean PCC>0.5.
| Gene1 | Gene2 | Mean PCC | Num. Datasets | Num. PCC<0 | Num. PCC>0.5 |
|---|---|---|---|---|---|
| TFF3 | BPIFB1 | 0.840673 | 6 | 0 | 6 |
| TFF3 | C6orf58 | 0.832303 | 6 | 0 | 6 |
| TFF3 | SSTR5-AS1 | 0.827081 | 3 | 0 | 3 |
| TFF3 | SCGB1D2 | 0.757009 | 7 | 0 | 7 |
| TFF3 | NOL4 | 0.739278 | 3 | 0 | 3 |
| TFF3 | SCGB2A2 | 0.735914 | 7 | 0 | 6 |
| TFF3 | NKX3-1 | 0.730982 | 7 | 0 | 6 |
| TFF3 | SCGB3A1 | 0.723995 | 6 | 0 | 5 |
| TFF3 | CHRM1 | 0.722454 | 5 | 0 | 4 |
| TFF3 | TSPAN8 | 0.72224 | 8 | 0 | 7 |
| TFF3 | GP2 | 0.719019 | 6 | 0 | 5 |
| TFF3 | SCGB2A1 | 0.708098 | 6 | 0 | 4 |
| TFF3 | C9orf152 | 0.69422 | 6 | 0 | 5 |
| TFF3 | MUC5B | 0.69208 | 11 | 0 | 8 |
| TFF3 | AZGP1 | 0.6892 | 8 | 0 | 5 |
| TFF3 | GLYATL2 | 0.686576 | 4 | 0 | 4 |
| TFF3 | ZG16B | 0.671381 | 7 | 0 | 5 |
| TFF3 | PEG10 | 0.670892 | 3 | 0 | 3 |
| TFF3 | PROM1 | 0.662325 | 8 | 0 | 7 |
| TFF3 | NXPE4 | 0.654939 | 7 | 0 | 4 |
For details and further investigation, click here