| Full name: tropomyosin 1 | Alias Symbol: | ||
| Type: protein-coding gene | Cytoband: 15q22.2 | ||
| Entrez ID: 7168 | HGNC ID: HGNC:12010 | Ensembl Gene: ENSG00000140416 | OMIM ID: 191010 |
TPM1 involved pathways:
| KEGG pathway | Description | View |
|---|---|---|
| hsa04261 | Adrenergic signaling in cardiomyocytes |
Expression of TPM1:
| Dataset | Gene | EntrezID | Probe | Log2FC | Adj.pValue | Expression |
|---|---|---|---|---|---|---|
| GSE17351 | TPM1 | 7168 | 210986_s_at | -1.4553 | 0.1890 | |
| GSE20347 | TPM1 | 7168 | 210986_s_at | 0.2938 | 0.6284 | |
| GSE23400 | TPM1 | 7168 | 210987_x_at | -0.5286 | 0.0265 | |
| GSE26886 | TPM1 | 7168 | 210986_s_at | 3.6330 | 0.0000 | |
| GSE29001 | TPM1 | 7168 | 210986_s_at | -0.2509 | 0.7213 | |
| GSE38129 | TPM1 | 7168 | 210986_s_at | -0.2289 | 0.6487 | |
| GSE45670 | TPM1 | 7168 | 210986_s_at | -2.3588 | 0.0000 | |
| GSE53622 | TPM1 | 7168 | 126698 | -1.2650 | 0.0000 | |
| GSE53624 | TPM1 | 7168 | 126698 | -0.7916 | 0.0000 | |
| GSE63941 | TPM1 | 7168 | 210986_s_at | -2.9067 | 0.0047 | |
| GSE77861 | TPM1 | 7168 | 210986_s_at | 2.6583 | 0.0005 | |
| GSE97050 | TPM1 | 7168 | A_23_P206018 | -1.7280 | 0.0885 | |
| SRP007169 | TPM1 | 7168 | RNAseq | 3.5650 | 0.0000 | |
| SRP008496 | TPM1 | 7168 | RNAseq | 4.3319 | 0.0000 | |
| SRP064894 | TPM1 | 7168 | RNAseq | -0.6727 | 0.0336 | |
| SRP133303 | TPM1 | 7168 | RNAseq | 0.0096 | 0.9865 | |
| SRP159526 | TPM1 | 7168 | RNAseq | -1.4612 | 0.0042 | |
| SRP193095 | TPM1 | 7168 | RNAseq | 0.6525 | 0.1093 | |
| SRP219564 | TPM1 | 7168 | RNAseq | -1.7312 | 0.1240 | |
| TCGA | TPM1 | 7168 | RNAseq | -0.3902 | 0.0000 |
Upregulated datasets: 4; Downregulated datasets: 4.
Survival by TPM1 expression:
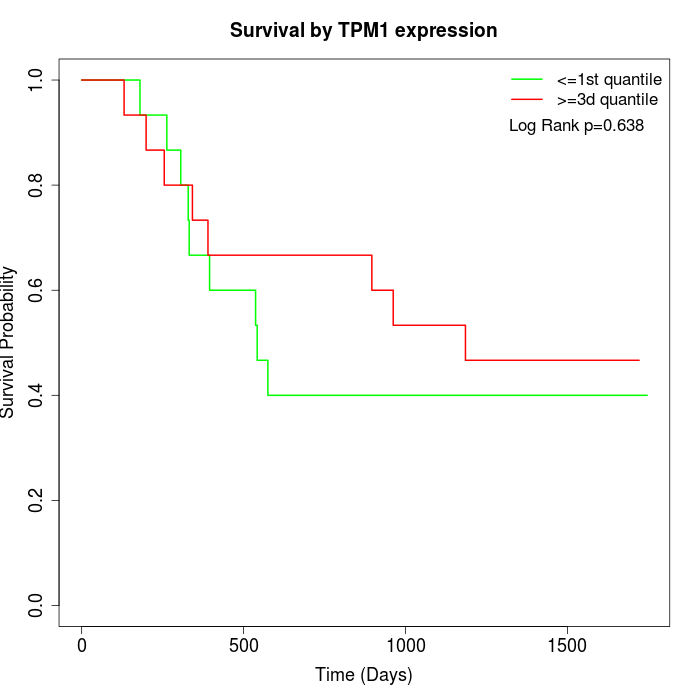 | 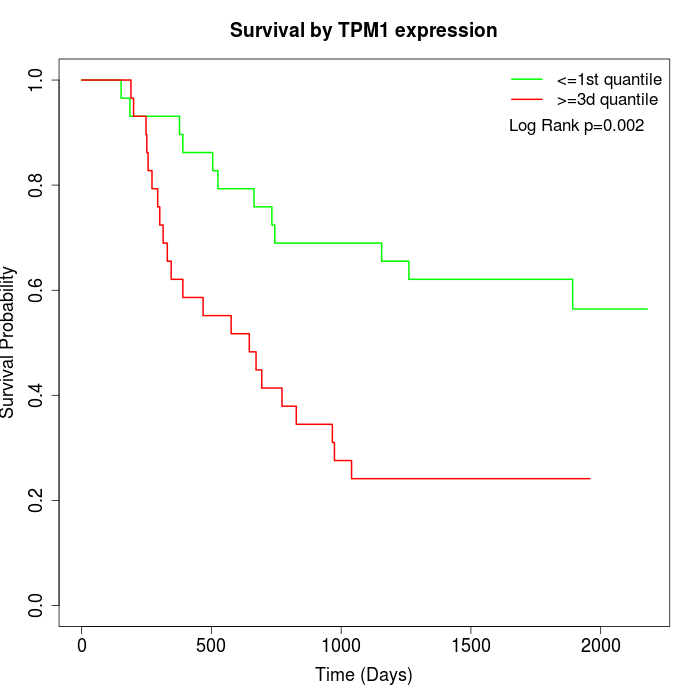 | 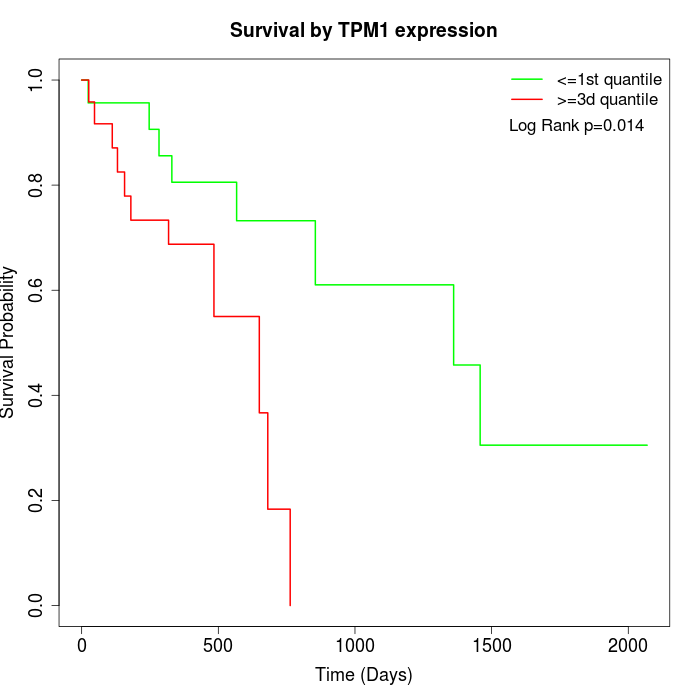 |
| GSE53622 | GSE53624 | TCGA |
Note: Click image to view full size file.
Copy number change of TPM1:
| Dataset | Gene | EntrezID | Gain | Loss | Normal | Detail |
|---|---|---|---|---|---|---|
| GSE15526 | TPM1 | 7168 | 8 | 2 | 20 | |
| GSE20123 | TPM1 | 7168 | 8 | 1 | 21 | |
| GSE43470 | TPM1 | 7168 | 4 | 6 | 33 | |
| GSE46452 | TPM1 | 7168 | 3 | 7 | 49 | |
| GSE47630 | TPM1 | 7168 | 8 | 10 | 22 | |
| GSE54993 | TPM1 | 7168 | 5 | 6 | 59 | |
| GSE54994 | TPM1 | 7168 | 6 | 8 | 39 | |
| GSE60625 | TPM1 | 7168 | 4 | 0 | 7 | |
| GSE74703 | TPM1 | 7168 | 4 | 3 | 29 | |
| GSE74704 | TPM1 | 7168 | 4 | 2 | 14 | |
| TCGA | TPM1 | 7168 | 10 | 17 | 69 |
Total number of gains: 64; Total number of losses: 62; Total Number of normals: 362.
Somatic mutations of TPM1:
Generating mutation plots.
Highly correlated genes for TPM1:
Showing top 20/909 corelated genes with mean PCC>0.5.
| Gene1 | Gene2 | Mean PCC | Num. Datasets | Num. PCC<0 | Num. PCC>0.5 |
|---|---|---|---|---|---|
| TPM1 | ACTA2 | 0.85762 | 13 | 0 | 13 |
| TPM1 | TPM2 | 0.856035 | 13 | 0 | 13 |
| TPM1 | MYLK | 0.852703 | 13 | 0 | 13 |
| TPM1 | CALD1 | 0.828666 | 13 | 0 | 12 |
| TPM1 | ACTBL2 | 0.817981 | 3 | 0 | 3 |
| TPM1 | PDLIM3 | 0.817612 | 13 | 0 | 13 |
| TPM1 | FERMT2 | 0.814483 | 13 | 0 | 13 |
| TPM1 | TMEM47 | 0.80509 | 13 | 0 | 13 |
| TPM1 | SMTN | 0.792509 | 10 | 0 | 10 |
| TPM1 | TGFB1I1 | 0.785757 | 12 | 0 | 12 |
| TPM1 | NEGR1 | 0.773444 | 6 | 0 | 6 |
| TPM1 | ACTG2 | 0.770093 | 13 | 0 | 13 |
| TPM1 | COPRS | 0.768601 | 3 | 0 | 3 |
| TPM1 | LPP | 0.764588 | 12 | 0 | 11 |
| TPM1 | SYNM | 0.755772 | 12 | 0 | 12 |
| TPM1 | NEXN | 0.755416 | 9 | 0 | 8 |
| TPM1 | CNN1 | 0.754501 | 11 | 0 | 10 |
| TPM1 | PKIG | 0.75389 | 13 | 0 | 12 |
| TPM1 | TBX5 | 0.751228 | 7 | 0 | 7 |
| TPM1 | MYOCD | 0.74608 | 7 | 0 | 6 |
For details and further investigation, click here