| Full name: tropomyosin 2 | Alias Symbol: DA1|NEM4 | ||
| Type: protein-coding gene | Cytoband: 9p13.3 | ||
| Entrez ID: 7169 | HGNC ID: HGNC:12011 | Ensembl Gene: ENSG00000198467 | OMIM ID: 190990 |
TPM2 involved pathways:
| KEGG pathway | Description | View |
|---|---|---|
| hsa04261 | Adrenergic signaling in cardiomyocytes |
Expression of TPM2:
| Dataset | Gene | EntrezID | Probe | Log2FC | Adj.pValue | Expression |
|---|---|---|---|---|---|---|
| GSE17351 | TPM2 | 7169 | 204083_s_at | -1.3835 | 0.2732 | |
| GSE20347 | TPM2 | 7169 | 204083_s_at | -0.3532 | 0.5524 | |
| GSE23400 | TPM2 | 7169 | 204083_s_at | -0.9166 | 0.0009 | |
| GSE26886 | TPM2 | 7169 | 204083_s_at | 3.1038 | 0.0000 | |
| GSE29001 | TPM2 | 7169 | 204083_s_at | -0.0766 | 0.9394 | |
| GSE38129 | TPM2 | 7169 | 204083_s_at | -0.7436 | 0.2334 | |
| GSE45670 | TPM2 | 7169 | 204083_s_at | -2.8823 | 0.0000 | |
| GSE53622 | TPM2 | 7169 | 96071 | -1.3271 | 0.0000 | |
| GSE53624 | TPM2 | 7169 | 96071 | -0.8387 | 0.0000 | |
| GSE63941 | TPM2 | 7169 | 204083_s_at | -6.0740 | 0.0039 | |
| GSE77861 | TPM2 | 7169 | 204083_s_at | 0.5428 | 0.1056 | |
| GSE97050 | TPM2 | 7169 | A_23_P216501 | -1.5895 | 0.1173 | |
| SRP007169 | TPM2 | 7169 | RNAseq | 4.6403 | 0.0000 | |
| SRP008496 | TPM2 | 7169 | RNAseq | 5.2988 | 0.0000 | |
| SRP064894 | TPM2 | 7169 | RNAseq | -0.8951 | 0.0147 | |
| SRP133303 | TPM2 | 7169 | RNAseq | -1.5405 | 0.0003 | |
| SRP159526 | TPM2 | 7169 | RNAseq | -1.4412 | 0.0143 | |
| SRP193095 | TPM2 | 7169 | RNAseq | 1.0862 | 0.0115 | |
| SRP219564 | TPM2 | 7169 | RNAseq | -1.6860 | 0.1243 | |
| TCGA | TPM2 | 7169 | RNAseq | -0.4284 | 0.0001 |
Upregulated datasets: 4; Downregulated datasets: 5.
Survival by TPM2 expression:
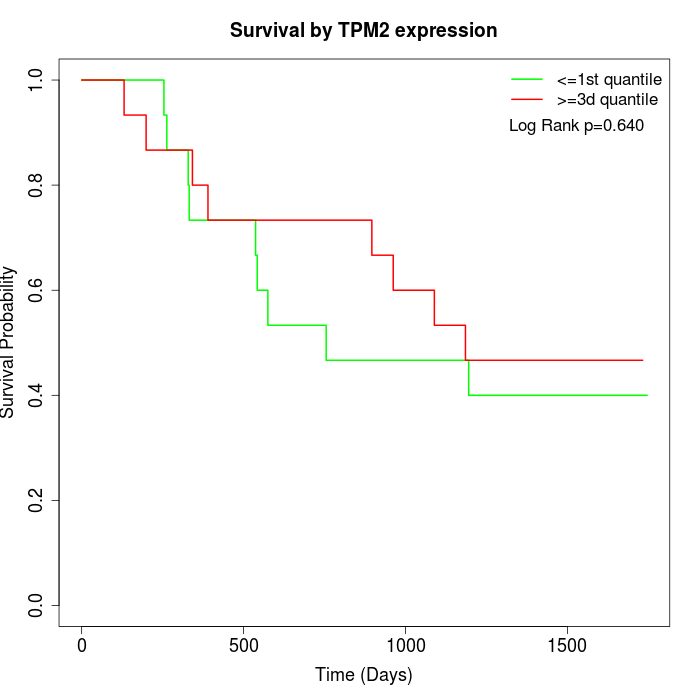 | 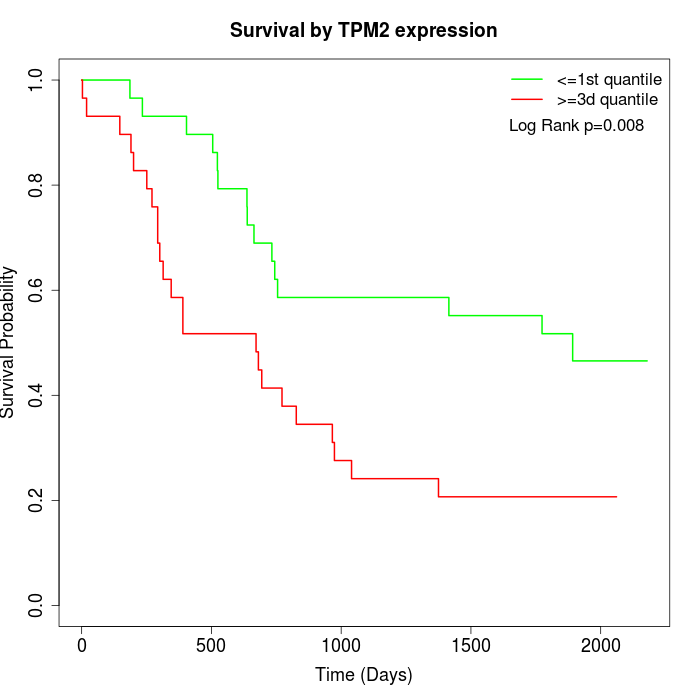 | 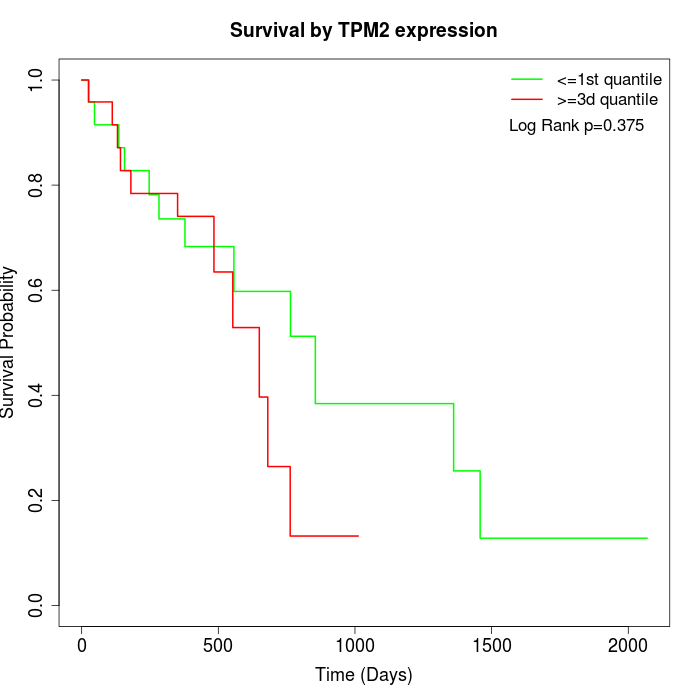 |
| GSE53622 | GSE53624 | TCGA |
Note: Click image to view full size file.
Copy number change of TPM2:
| Dataset | Gene | EntrezID | Gain | Loss | Normal | Detail |
|---|---|---|---|---|---|---|
| GSE15526 | TPM2 | 7169 | 3 | 12 | 15 | |
| GSE20123 | TPM2 | 7169 | 3 | 12 | 15 | |
| GSE43470 | TPM2 | 7169 | 3 | 10 | 30 | |
| GSE46452 | TPM2 | 7169 | 6 | 15 | 38 | |
| GSE47630 | TPM2 | 7169 | 1 | 20 | 19 | |
| GSE54993 | TPM2 | 7169 | 6 | 0 | 64 | |
| GSE54994 | TPM2 | 7169 | 6 | 12 | 35 | |
| GSE60625 | TPM2 | 7169 | 0 | 0 | 11 | |
| GSE74703 | TPM2 | 7169 | 2 | 7 | 27 | |
| GSE74704 | TPM2 | 7169 | 0 | 10 | 10 | |
| TCGA | TPM2 | 7169 | 17 | 44 | 35 |
Total number of gains: 47; Total number of losses: 142; Total Number of normals: 299.
Somatic mutations of TPM2:
Generating mutation plots.
Highly correlated genes for TPM2:
Showing top 20/1056 corelated genes with mean PCC>0.5.
| Gene1 | Gene2 | Mean PCC | Num. Datasets | Num. PCC<0 | Num. PCC>0.5 |
|---|---|---|---|---|---|
| TPM2 | ACTA2 | 0.876577 | 13 | 0 | 13 |
| TPM2 | TPM1 | 0.856035 | 13 | 0 | 13 |
| TPM2 | TAGLN | 0.847629 | 12 | 0 | 12 |
| TPM2 | ACTG2 | 0.835693 | 13 | 0 | 13 |
| TPM2 | ACTBL2 | 0.832134 | 3 | 0 | 3 |
| TPM2 | MYLK | 0.830019 | 13 | 0 | 13 |
| TPM2 | MSRB3 | 0.823321 | 7 | 0 | 7 |
| TPM2 | NEXN | 0.810432 | 9 | 0 | 9 |
| TPM2 | CNN1 | 0.80607 | 11 | 0 | 11 |
| TPM2 | TGFB1I1 | 0.802552 | 12 | 0 | 12 |
| TPM2 | TMEM47 | 0.801672 | 13 | 0 | 13 |
| TPM2 | CALD1 | 0.800304 | 13 | 0 | 13 |
| TPM2 | FERMT2 | 0.797548 | 13 | 0 | 13 |
| TPM2 | PDLIM3 | 0.795487 | 13 | 0 | 12 |
| TPM2 | DIXDC1 | 0.794825 | 10 | 0 | 10 |
| TPM2 | FLNC | 0.793724 | 12 | 0 | 11 |
| TPM2 | MYOCD | 0.789951 | 7 | 0 | 7 |
| TPM2 | PPP1R14A | 0.783221 | 8 | 0 | 7 |
| TPM2 | SMTN | 0.778949 | 10 | 0 | 9 |
| TPM2 | PLN | 0.773311 | 13 | 0 | 12 |
For details and further investigation, click here