| Full name: thrombomodulin | Alias Symbol: CD141 | ||
| Type: protein-coding gene | Cytoband: 20p11.21 | ||
| Entrez ID: 7056 | HGNC ID: HGNC:11784 | Ensembl Gene: ENSG00000178726 | OMIM ID: 188040 |
| Related drugs: ALPROSTADIL, CILOSTAZOL, CURCUMIN, GINKGO, LEVOTHYROXINE, SIMVASTATIN... [more] | |||
THBD involved pathways:
| KEGG pathway | Description | View |
|---|---|---|
| hsa04610 | Complement and coagulation cascades | |
| hsa04933 | AGE-RAGE signaling pathway in diabetic complications |
Expression of THBD:
| Dataset | Gene | EntrezID | Probe | Log2FC | Adj.pValue | Expression |
|---|---|---|---|---|---|---|
| GSE17351 | THBD | 7056 | 203887_s_at | 0.9783 | 0.5209 | |
| GSE20347 | THBD | 7056 | 203887_s_at | -0.3480 | 0.5269 | |
| GSE23400 | THBD | 7056 | 203887_s_at | 0.2107 | 0.2849 | |
| GSE26886 | THBD | 7056 | 203887_s_at | -0.0836 | 0.8914 | |
| GSE29001 | THBD | 7056 | 203887_s_at | 0.4478 | 0.5064 | |
| GSE38129 | THBD | 7056 | 203887_s_at | -0.0673 | 0.8797 | |
| GSE45670 | THBD | 7056 | 203887_s_at | 0.1439 | 0.6409 | |
| GSE53622 | THBD | 7056 | 98535 | -0.4393 | 0.0052 | |
| GSE53624 | THBD | 7056 | 98535 | -0.0106 | 0.9378 | |
| GSE63941 | THBD | 7056 | 203887_s_at | 0.8632 | 0.7009 | |
| GSE77861 | THBD | 7056 | 203887_s_at | -0.2481 | 0.7593 | |
| GSE97050 | THBD | 7056 | A_23_P91390 | 0.2922 | 0.4863 | |
| SRP007169 | THBD | 7056 | RNAseq | -0.3041 | 0.6749 | |
| SRP008496 | THBD | 7056 | RNAseq | 0.1148 | 0.8613 | |
| SRP064894 | THBD | 7056 | RNAseq | -0.1260 | 0.6767 | |
| SRP133303 | THBD | 7056 | RNAseq | 0.6938 | 0.0839 | |
| SRP159526 | THBD | 7056 | RNAseq | 0.4338 | 0.6084 | |
| SRP193095 | THBD | 7056 | RNAseq | 0.2568 | 0.2886 | |
| SRP219564 | THBD | 7056 | RNAseq | 0.7169 | 0.0357 | |
| TCGA | THBD | 7056 | RNAseq | 0.2041 | 0.0903 |
Upregulated datasets: 0; Downregulated datasets: 0.
Survival by THBD expression:
 | 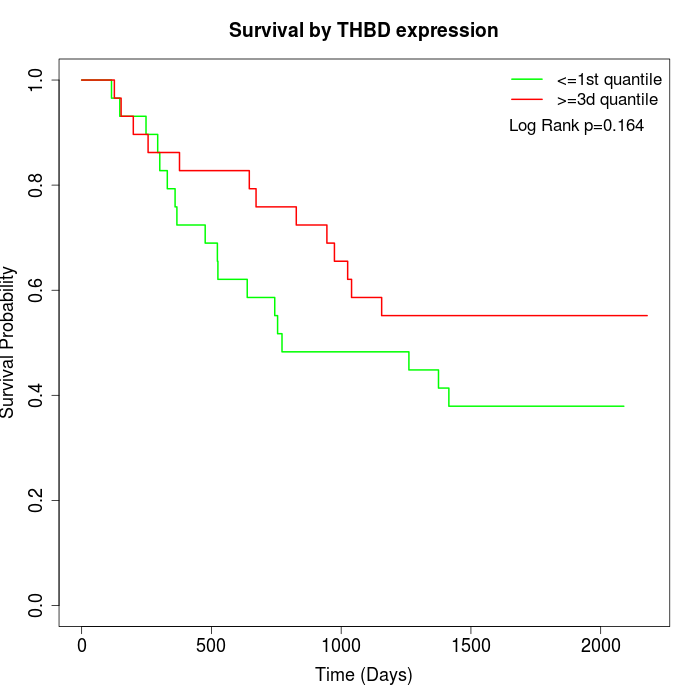 | 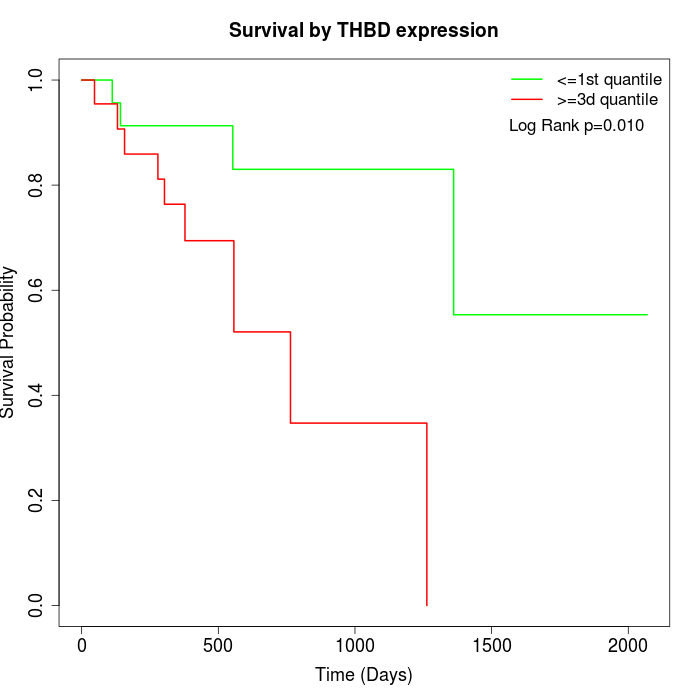 |
| GSE53622 | GSE53624 | TCGA |
Note: Click image to view full size file.
Copy number change of THBD:
| Dataset | Gene | EntrezID | Gain | Loss | Normal | Detail |
|---|---|---|---|---|---|---|
| GSE15526 | THBD | 7056 | 13 | 1 | 16 | |
| GSE20123 | THBD | 7056 | 13 | 1 | 16 | |
| GSE43470 | THBD | 7056 | 11 | 1 | 31 | |
| GSE46452 | THBD | 7056 | 27 | 1 | 31 | |
| GSE47630 | THBD | 7056 | 17 | 4 | 19 | |
| GSE54993 | THBD | 7056 | 0 | 17 | 53 | |
| GSE54994 | THBD | 7056 | 26 | 2 | 25 | |
| GSE60625 | THBD | 7056 | 0 | 0 | 11 | |
| GSE74703 | THBD | 7056 | 9 | 1 | 26 | |
| GSE74704 | THBD | 7056 | 7 | 1 | 12 | |
| TCGA | THBD | 7056 | 42 | 11 | 43 |
Total number of gains: 165; Total number of losses: 40; Total Number of normals: 283.
Somatic mutations of THBD:
Generating mutation plots.
Highly correlated genes for THBD:
Showing top 20/110 corelated genes with mean PCC>0.5.
| Gene1 | Gene2 | Mean PCC | Num. Datasets | Num. PCC<0 | Num. PCC>0.5 |
|---|---|---|---|---|---|
| THBD | DBN1 | 0.772737 | 3 | 0 | 3 |
| THBD | TCERG1 | 0.741857 | 3 | 0 | 3 |
| THBD | SGMS1 | 0.722955 | 3 | 0 | 3 |
| THBD | MRPL9 | 0.71793 | 3 | 0 | 3 |
| THBD | MPP6 | 0.710536 | 3 | 0 | 3 |
| THBD | TRNT1 | 0.7041 | 3 | 0 | 3 |
| THBD | LAMTOR1 | 0.701264 | 3 | 0 | 3 |
| THBD | COMMD9 | 0.683054 | 4 | 0 | 3 |
| THBD | ACTR3 | 0.681119 | 4 | 0 | 3 |
| THBD | SLC7A6OS | 0.679375 | 3 | 0 | 3 |
| THBD | BFSP1 | 0.678319 | 3 | 0 | 3 |
| THBD | FAM20C | 0.670237 | 3 | 0 | 3 |
| THBD | CHCHD4 | 0.664386 | 3 | 0 | 3 |
| THBD | TMEM186 | 0.65494 | 3 | 0 | 3 |
| THBD | CAMKK1 | 0.65308 | 4 | 0 | 3 |
| THBD | CCT6A | 0.649743 | 3 | 0 | 3 |
| THBD | PPP6C | 0.647306 | 3 | 0 | 3 |
| THBD | HARS2 | 0.647033 | 4 | 0 | 3 |
| THBD | SRP19 | 0.646938 | 4 | 0 | 3 |
| THBD | PDHX | 0.642452 | 4 | 0 | 3 |
For details and further investigation, click here