| Full name: TMEM51 antisense RNA 1 | Alias Symbol: FLJ23703 | ||
| Type: non-coding RNA | Cytoband: 1p36.21 | ||
| Entrez ID: 200197 | HGNC ID: HGNC:26301 | Ensembl Gene: ENSG00000175147 | OMIM ID: |
Expression of TMEM51-AS1:
| Dataset | Gene | EntrezID | Probe | Log2FC | Adj.pValue | Expression |
|---|---|---|---|---|---|---|
| GSE17351 | TMEM51-AS1 | 200197 | 238641_at | 0.1084 | 0.6730 | |
| GSE26886 | TMEM51-AS1 | 200197 | 238641_at | 0.3739 | 0.0009 | |
| GSE45670 | TMEM51-AS1 | 200197 | 238641_at | -0.0053 | 0.9592 | |
| GSE53622 | TMEM51-AS1 | 200197 | 84218 | -1.0914 | 0.0000 | |
| GSE53624 | TMEM51-AS1 | 200197 | 84218 | -1.4471 | 0.0000 | |
| GSE63941 | TMEM51-AS1 | 200197 | 238641_at | -0.0024 | 0.9923 | |
| GSE77861 | TMEM51-AS1 | 200197 | 238641_at | -0.2004 | 0.0533 | |
| SRP064894 | TMEM51-AS1 | 200197 | RNAseq | -1.2089 | 0.0000 | |
| SRP133303 | TMEM51-AS1 | 200197 | RNAseq | -0.8221 | 0.0039 | |
| SRP193095 | TMEM51-AS1 | 200197 | RNAseq | -0.8531 | 0.0007 | |
| SRP219564 | TMEM51-AS1 | 200197 | RNAseq | -1.3592 | 0.0077 |
Upregulated datasets: 0; Downregulated datasets: 4.
Survival by TMEM51-AS1 expression:
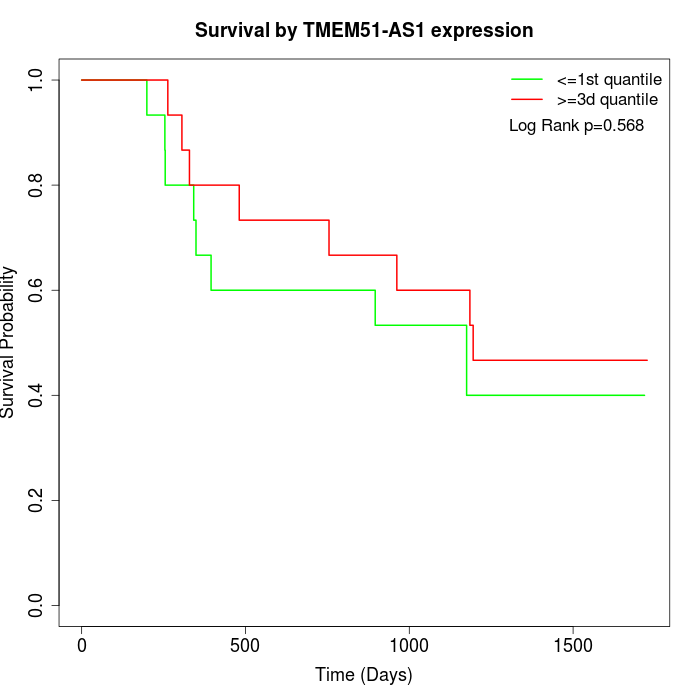 | 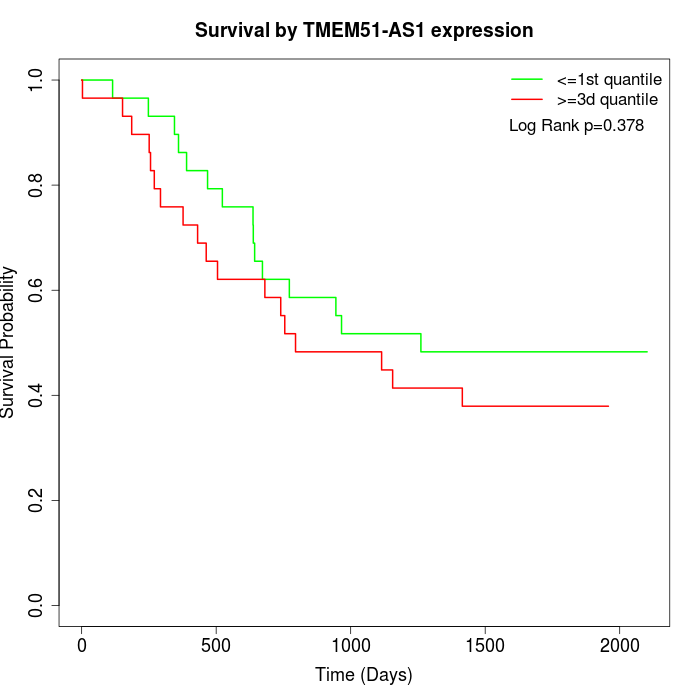 |
| GSE53622 | GSE53624 |
Note: Click image to view full size file.
Copy number change of TMEM51-AS1:
| Dataset | Gene | EntrezID | Gain | Loss | Normal | Detail |
|---|---|---|---|---|---|---|
| GSE15526 | TMEM51-AS1 | 200197 | 0 | 4 | 26 | |
| GSE20123 | TMEM51-AS1 | 200197 | 0 | 3 | 27 | |
| GSE43470 | TMEM51-AS1 | 200197 | 1 | 8 | 34 | |
| GSE46452 | TMEM51-AS1 | 200197 | 7 | 1 | 51 | |
| GSE47630 | TMEM51-AS1 | 200197 | 8 | 3 | 29 | |
| GSE54993 | TMEM51-AS1 | 200197 | 3 | 1 | 66 | |
| GSE54994 | TMEM51-AS1 | 200197 | 10 | 4 | 39 | |
| GSE60625 | TMEM51-AS1 | 200197 | 0 | 0 | 11 | |
| GSE74703 | TMEM51-AS1 | 200197 | 1 | 5 | 30 | |
| GSE74704 | TMEM51-AS1 | 200197 | 0 | 0 | 20 |
Total number of gains: 30; Total number of losses: 29; Total Number of normals: 333.
Somatic mutations of TMEM51-AS1:
Generating mutation plots.
Highly correlated genes for TMEM51-AS1:
Showing top 20/115 corelated genes with mean PCC>0.5.
| Gene1 | Gene2 | Mean PCC | Num. Datasets | Num. PCC<0 | Num. PCC>0.5 |
|---|---|---|---|---|---|
| TMEM51-AS1 | HMCN2 | 0.698508 | 3 | 0 | 3 |
| TMEM51-AS1 | PLEKHA4 | 0.693209 | 3 | 0 | 3 |
| TMEM51-AS1 | TMEM151B | 0.690057 | 3 | 0 | 3 |
| TMEM51-AS1 | MKNK2 | 0.688026 | 3 | 0 | 3 |
| TMEM51-AS1 | PHOX2A | 0.684856 | 3 | 0 | 3 |
| TMEM51-AS1 | ANKRD31 | 0.682234 | 3 | 0 | 3 |
| TMEM51-AS1 | IL12A-AS1 | 0.680093 | 3 | 0 | 3 |
| TMEM51-AS1 | ICA1 | 0.676396 | 3 | 0 | 3 |
| TMEM51-AS1 | AGAP2 | 0.672597 | 3 | 0 | 3 |
| TMEM51-AS1 | ECHDC3 | 0.671686 | 3 | 0 | 3 |
| TMEM51-AS1 | GALE | 0.671133 | 3 | 0 | 3 |
| TMEM51-AS1 | ORM1 | 0.661504 | 3 | 0 | 3 |
| TMEM51-AS1 | DHDDS | 0.659013 | 3 | 0 | 3 |
| TMEM51-AS1 | HES7 | 0.656665 | 4 | 0 | 4 |
| TMEM51-AS1 | PCDH1 | 0.654737 | 3 | 0 | 3 |
| TMEM51-AS1 | TFEB | 0.654077 | 3 | 0 | 3 |
| TMEM51-AS1 | ATP2B2 | 0.651388 | 3 | 0 | 3 |
| TMEM51-AS1 | ARHGAP4 | 0.648902 | 3 | 0 | 3 |
| TMEM51-AS1 | CD70 | 0.648613 | 3 | 0 | 3 |
| TMEM51-AS1 | ZBTB32 | 0.647955 | 3 | 0 | 3 |
For details and further investigation, click here