| Full name: transmembrane serine protease 15 | Alias Symbol: ENTK|MGC133046 | ||
| Type: protein-coding gene | Cytoband: 21q21.1 | ||
| Entrez ID: 5651 | HGNC ID: HGNC:9490 | Ensembl Gene: ENSG00000154646 | OMIM ID: 606635 |
Expression of TMPRSS15:
| Dataset | Gene | EntrezID | Probe | Log2FC | Adj.pValue | Expression |
|---|---|---|---|---|---|---|
| GSE17351 | TMPRSS15 | 5651 | 217269_s_at | 0.3791 | 0.5347 | |
| GSE20347 | TMPRSS15 | 5651 | 217269_s_at | -0.1072 | 0.3224 | |
| GSE23400 | TMPRSS15 | 5651 | 217269_s_at | -0.2553 | 0.0000 | |
| GSE26886 | TMPRSS15 | 5651 | 217269_s_at | -0.2240 | 0.0540 | |
| GSE29001 | TMPRSS15 | 5651 | 217269_s_at | -0.1364 | 0.5446 | |
| GSE38129 | TMPRSS15 | 5651 | 217269_s_at | -0.1040 | 0.4291 | |
| GSE45670 | TMPRSS15 | 5651 | 217269_s_at | -0.0605 | 0.6632 | |
| GSE53622 | TMPRSS15 | 5651 | 7829 | -0.0454 | 0.6393 | |
| GSE53624 | TMPRSS15 | 5651 | 7829 | -0.0115 | 0.9268 | |
| GSE63941 | TMPRSS15 | 5651 | 217269_s_at | 0.2693 | 0.7288 | |
| GSE77861 | TMPRSS15 | 5651 | 217269_s_at | -0.2358 | 0.1309 | |
| TCGA | TMPRSS15 | 5651 | RNAseq | 3.2913 | 0.0004 |
Upregulated datasets: 1; Downregulated datasets: 0.
Survival by TMPRSS15 expression:
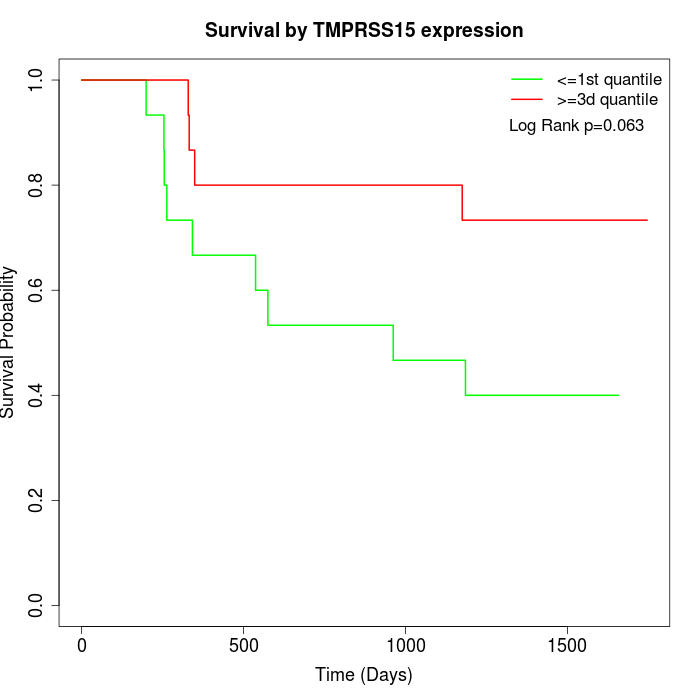 | 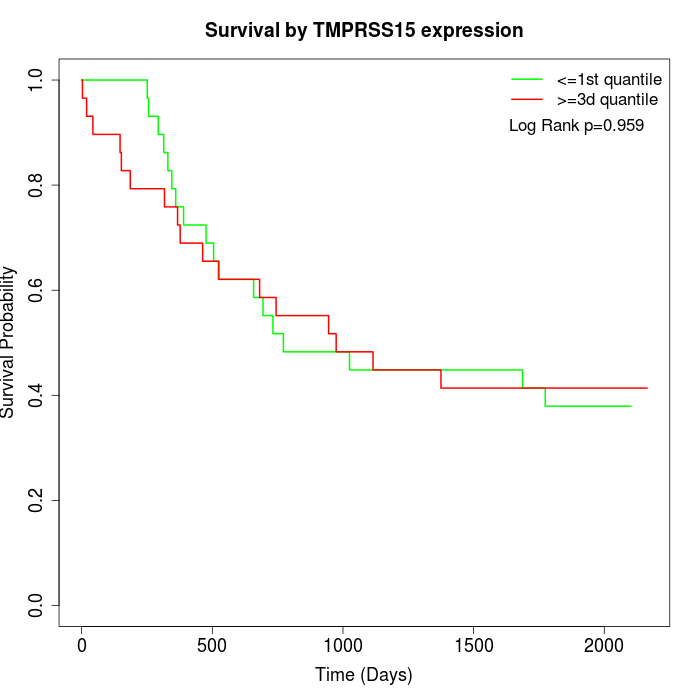 | 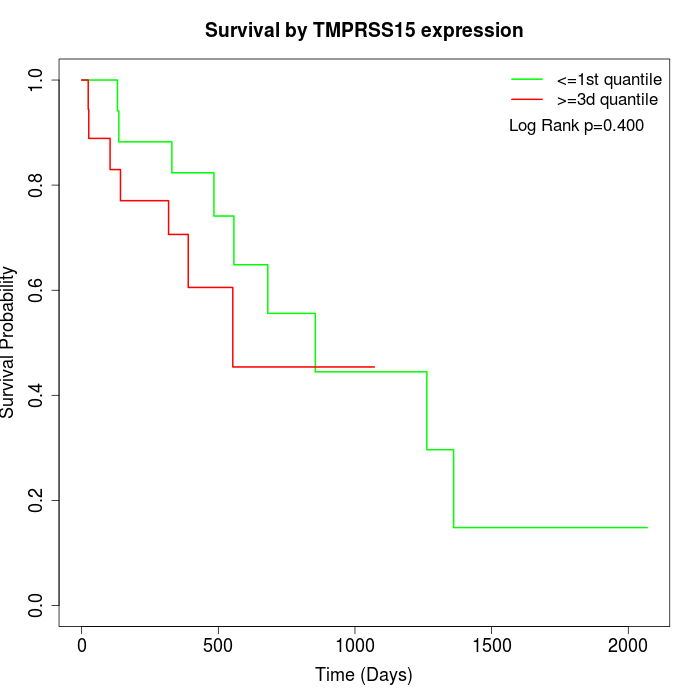 |
| GSE53622 | GSE53624 | TCGA |
Note: Click image to view full size file.
Copy number change of TMPRSS15:
| Dataset | Gene | EntrezID | Gain | Loss | Normal | Detail |
|---|---|---|---|---|---|---|
| GSE15526 | TMPRSS15 | 5651 | 1 | 13 | 16 | |
| GSE20123 | TMPRSS15 | 5651 | 1 | 13 | 16 | |
| GSE43470 | TMPRSS15 | 5651 | 1 | 11 | 31 | |
| GSE46452 | TMPRSS15 | 5651 | 1 | 22 | 36 | |
| GSE47630 | TMPRSS15 | 5651 | 6 | 17 | 17 | |
| GSE54993 | TMPRSS15 | 5651 | 9 | 1 | 60 | |
| GSE54994 | TMPRSS15 | 5651 | 3 | 9 | 41 | |
| GSE60625 | TMPRSS15 | 5651 | 0 | 0 | 11 | |
| GSE74703 | TMPRSS15 | 5651 | 1 | 8 | 27 | |
| GSE74704 | TMPRSS15 | 5651 | 1 | 9 | 10 | |
| TCGA | TMPRSS15 | 5651 | 10 | 41 | 45 |
Total number of gains: 34; Total number of losses: 144; Total Number of normals: 310.
Somatic mutations of TMPRSS15:
Generating mutation plots.
Highly correlated genes for TMPRSS15:
Showing top 20/743 corelated genes with mean PCC>0.5.
| Gene1 | Gene2 | Mean PCC | Num. Datasets | Num. PCC<0 | Num. PCC>0.5 |
|---|---|---|---|---|---|
| TMPRSS15 | CGA | 0.708894 | 4 | 0 | 4 |
| TMPRSS15 | SLCO4C1 | 0.707481 | 4 | 0 | 4 |
| TMPRSS15 | GABRR2 | 0.69108 | 5 | 0 | 5 |
| TMPRSS15 | ADRB3 | 0.680892 | 4 | 0 | 3 |
| TMPRSS15 | P2RX6 | 0.677896 | 7 | 0 | 6 |
| TMPRSS15 | MVK | 0.675105 | 7 | 0 | 7 |
| TMPRSS15 | MYBPC3 | 0.673303 | 6 | 0 | 5 |
| TMPRSS15 | LRTM1 | 0.672261 | 5 | 0 | 5 |
| TMPRSS15 | CCDC87 | 0.672112 | 4 | 0 | 4 |
| TMPRSS15 | EPHA5 | 0.67138 | 4 | 0 | 4 |
| TMPRSS15 | NR5A1 | 0.671269 | 6 | 0 | 6 |
| TMPRSS15 | IBA57 | 0.669399 | 6 | 0 | 6 |
| TMPRSS15 | GCG | 0.668952 | 4 | 0 | 4 |
| TMPRSS15 | CAMK1G | 0.667688 | 5 | 0 | 5 |
| TMPRSS15 | LINC00216 | 0.666552 | 4 | 0 | 4 |
| TMPRSS15 | EPS8L3 | 0.666429 | 4 | 0 | 4 |
| TMPRSS15 | PAX3 | 0.66564 | 6 | 0 | 6 |
| TMPRSS15 | CITED1 | 0.661787 | 3 | 0 | 3 |
| TMPRSS15 | NOS1 | 0.661679 | 5 | 0 | 4 |
| TMPRSS15 | ZNF460 | 0.66146 | 4 | 0 | 4 |
For details and further investigation, click here