| Full name: trophoblast glycoprotein | Alias Symbol: 5T4-AG|5T4 | ||
| Type: protein-coding gene | Cytoband: 6q14.1 | ||
| Entrez ID: 7162 | HGNC ID: HGNC:12004 | Ensembl Gene: ENSG00000146242 | OMIM ID: 190920 |
| Related drugs: ANATUMOMAB MAFENATOX, NAPTUMOMAB ESTAFENATOX... [more] | |||
Expression of TPBG:
| Dataset | Gene | EntrezID | Probe | Log2FC | Adj.pValue | Expression |
|---|---|---|---|---|---|---|
| GSE17351 | TPBG | 7162 | 203476_at | -0.4059 | 0.6528 | |
| GSE20347 | TPBG | 7162 | 203476_at | 0.7505 | 0.0002 | |
| GSE23400 | TPBG | 7162 | 203476_at | 0.5204 | 0.0002 | |
| GSE26886 | TPBG | 7162 | 203476_at | 1.8410 | 0.0000 | |
| GSE29001 | TPBG | 7162 | 203476_at | 0.9707 | 0.0005 | |
| GSE38129 | TPBG | 7162 | 203476_at | 0.4496 | 0.0588 | |
| GSE45670 | TPBG | 7162 | 203476_at | 0.2137 | 0.5168 | |
| GSE53622 | TPBG | 7162 | 15635 | 0.7802 | 0.0000 | |
| GSE53624 | TPBG | 7162 | 15635 | 0.8080 | 0.0000 | |
| GSE63941 | TPBG | 7162 | 203476_at | -0.5407 | 0.3031 | |
| GSE77861 | TPBG | 7162 | 203476_at | 1.6150 | 0.0020 | |
| GSE97050 | TPBG | 7162 | A_23_P59261 | -0.2069 | 0.4964 | |
| SRP007169 | TPBG | 7162 | RNAseq | 2.0709 | 0.0000 | |
| SRP008496 | TPBG | 7162 | RNAseq | 1.8496 | 0.0000 | |
| SRP064894 | TPBG | 7162 | RNAseq | 0.6389 | 0.0052 | |
| SRP133303 | TPBG | 7162 | RNAseq | 0.7180 | 0.0101 | |
| SRP159526 | TPBG | 7162 | RNAseq | -0.1535 | 0.6803 | |
| SRP193095 | TPBG | 7162 | RNAseq | 1.4291 | 0.0000 | |
| SRP219564 | TPBG | 7162 | RNAseq | -0.1901 | 0.7724 | |
| TCGA | TPBG | 7162 | RNAseq | 0.3644 | 0.0000 |
Upregulated datasets: 5; Downregulated datasets: 0.
Survival by TPBG expression:
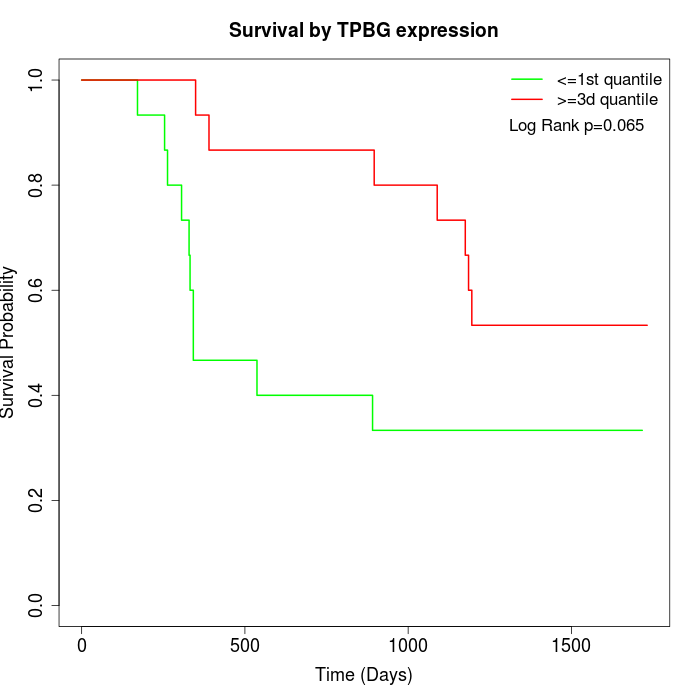 | 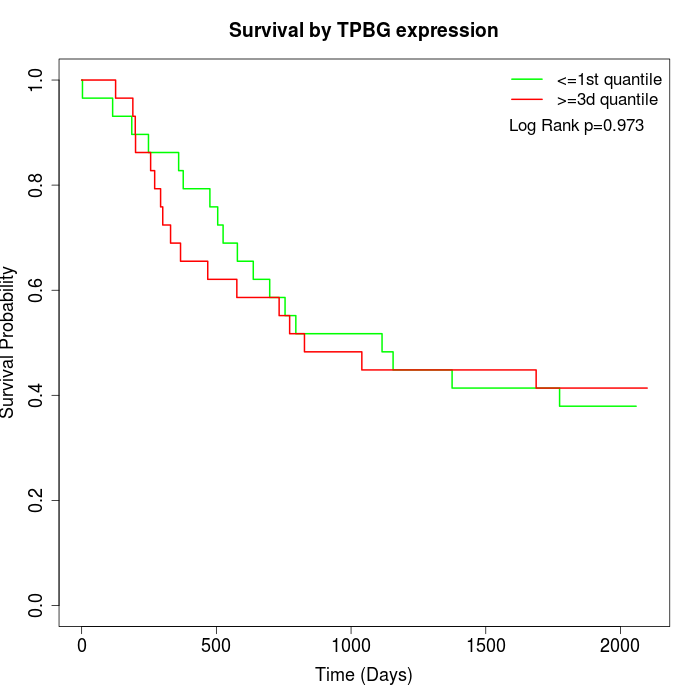 | 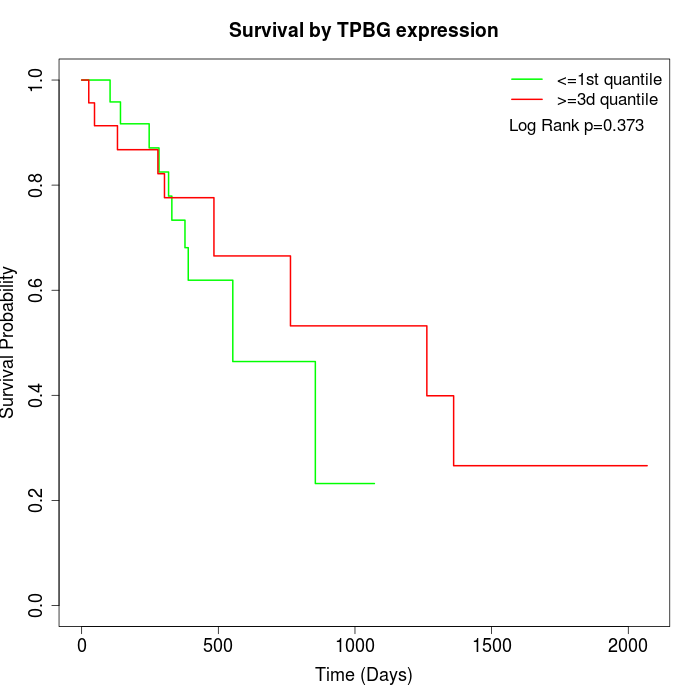 |
| GSE53622 | GSE53624 | TCGA |
Note: Click image to view full size file.
Copy number change of TPBG:
| Dataset | Gene | EntrezID | Gain | Loss | Normal | Detail |
|---|---|---|---|---|---|---|
| GSE15526 | TPBG | 7162 | 1 | 4 | 25 | |
| GSE20123 | TPBG | 7162 | 1 | 3 | 26 | |
| GSE43470 | TPBG | 7162 | 2 | 1 | 40 | |
| GSE46452 | TPBG | 7162 | 2 | 11 | 46 | |
| GSE47630 | TPBG | 7162 | 8 | 6 | 26 | |
| GSE54993 | TPBG | 7162 | 3 | 2 | 65 | |
| GSE54994 | TPBG | 7162 | 8 | 7 | 38 | |
| GSE60625 | TPBG | 7162 | 0 | 1 | 10 | |
| GSE74703 | TPBG | 7162 | 2 | 1 | 33 | |
| GSE74704 | TPBG | 7162 | 0 | 2 | 18 | |
| TCGA | TPBG | 7162 | 7 | 21 | 68 |
Total number of gains: 34; Total number of losses: 59; Total Number of normals: 395.
Somatic mutations of TPBG:
Generating mutation plots.
Highly correlated genes for TPBG:
Showing top 20/942 corelated genes with mean PCC>0.5.
| Gene1 | Gene2 | Mean PCC | Num. Datasets | Num. PCC<0 | Num. PCC>0.5 |
|---|---|---|---|---|---|
| TPBG | MRGPRF | 0.747563 | 3 | 0 | 3 |
| TPBG | KLHL31 | 0.728666 | 3 | 0 | 3 |
| TPBG | RBM24 | 0.722217 | 3 | 0 | 3 |
| TPBG | COL4A5 | 0.721345 | 11 | 0 | 11 |
| TPBG | TMTC1 | 0.720416 | 4 | 0 | 4 |
| TPBG | C20orf194 | 0.719963 | 3 | 0 | 3 |
| TPBG | CLIC4 | 0.717275 | 11 | 0 | 11 |
| TPBG | CCNT1 | 0.710498 | 3 | 0 | 3 |
| TPBG | KLF7 | 0.707373 | 11 | 0 | 11 |
| TPBG | IRS2 | 0.705096 | 4 | 0 | 4 |
| TPBG | DNAJC18 | 0.70507 | 4 | 0 | 3 |
| TPBG | CHST15 | 0.704666 | 11 | 0 | 11 |
| TPBG | LTBP1 | 0.700958 | 11 | 0 | 11 |
| TPBG | FEZ1 | 0.699063 | 12 | 0 | 11 |
| TPBG | RILPL1 | 0.697326 | 4 | 0 | 4 |
| TPBG | HMCN1 | 0.694187 | 5 | 0 | 4 |
| TPBG | CALML4 | 0.692066 | 5 | 0 | 5 |
| TPBG | MAP3K13 | 0.690405 | 3 | 0 | 3 |
| TPBG | JUN | 0.689682 | 3 | 0 | 3 |
| TPBG | MACF1 | 0.68792 | 12 | 0 | 10 |
For details and further investigation, click here