| Full name: insulin receptor substrate 2 | Alias Symbol: | ||
| Type: protein-coding gene | Cytoband: 13q34 | ||
| Entrez ID: 8660 | HGNC ID: HGNC:6126 | Ensembl Gene: ENSG00000185950 | OMIM ID: 600797 |
| Related drugs: ASPIRIN, DEXAMETHASONE... [more] | |||
Screen Evidence:
| |||
IRS2 involved pathways:
Expression of IRS2:
| Dataset | Gene | EntrezID | Probe | Log2FC | Adj.pValue | Expression |
|---|---|---|---|---|---|---|
| GSE17351 | IRS2 | 8660 | 209185_s_at | -0.9197 | 0.3093 | |
| GSE20347 | IRS2 | 8660 | 209185_s_at | 0.7350 | 0.1235 | |
| GSE23400 | IRS2 | 8660 | 209185_s_at | 0.2519 | 0.1416 | |
| GSE26886 | IRS2 | 8660 | 209185_s_at | 2.6430 | 0.0000 | |
| GSE29001 | IRS2 | 8660 | 209185_s_at | 0.0214 | 0.9673 | |
| GSE38129 | IRS2 | 8660 | 209185_s_at | 0.4610 | 0.1887 | |
| GSE45670 | IRS2 | 8660 | 209185_s_at | -1.1046 | 0.0319 | |
| GSE53622 | IRS2 | 8660 | 118225 | -0.0137 | 0.9409 | |
| GSE53624 | IRS2 | 8660 | 118225 | 0.2697 | 0.0668 | |
| GSE63941 | IRS2 | 8660 | 209185_s_at | -1.5803 | 0.1662 | |
| GSE77861 | IRS2 | 8660 | 209185_s_at | 1.5065 | 0.0123 | |
| GSE97050 | IRS2 | 8660 | A_24_P154037 | -1.0070 | 0.1218 | |
| SRP007169 | IRS2 | 8660 | RNAseq | 1.4036 | 0.0090 | |
| SRP008496 | IRS2 | 8660 | RNAseq | 1.0721 | 0.0200 | |
| SRP064894 | IRS2 | 8660 | RNAseq | 0.3284 | 0.2052 | |
| SRP133303 | IRS2 | 8660 | RNAseq | 0.1825 | 0.5919 | |
| SRP159526 | IRS2 | 8660 | RNAseq | 0.5808 | 0.2638 | |
| SRP193095 | IRS2 | 8660 | RNAseq | 0.6889 | 0.0171 | |
| SRP219564 | IRS2 | 8660 | RNAseq | 1.0675 | 0.0429 | |
| TCGA | IRS2 | 8660 | RNAseq | -0.1782 | 0.0805 |
Upregulated datasets: 5; Downregulated datasets: 1.
Survival by IRS2 expression:
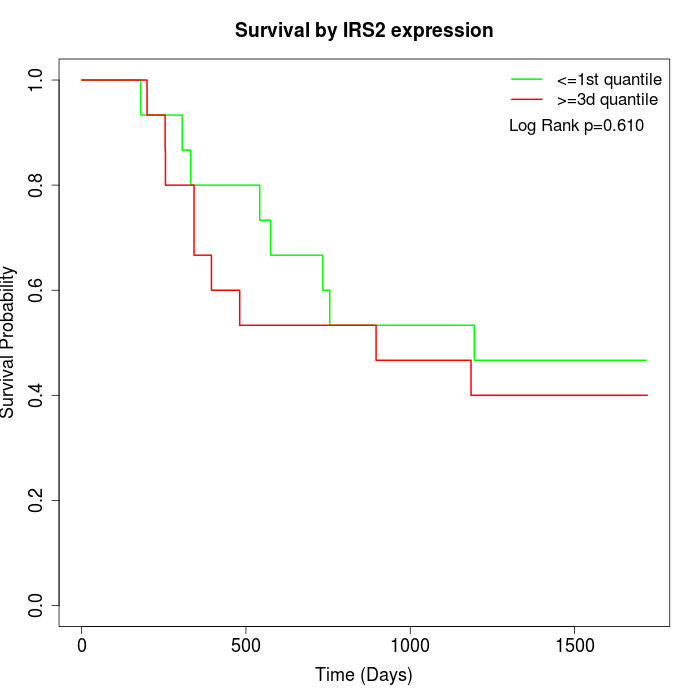 | 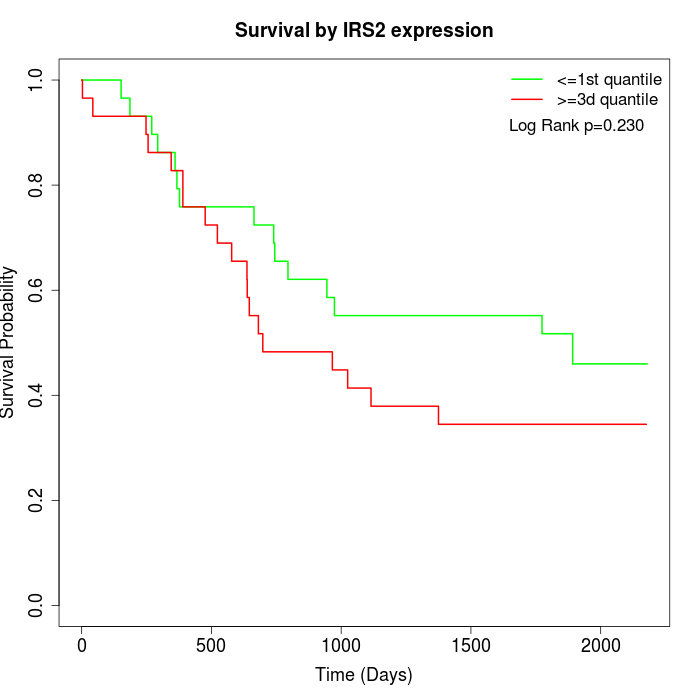 | 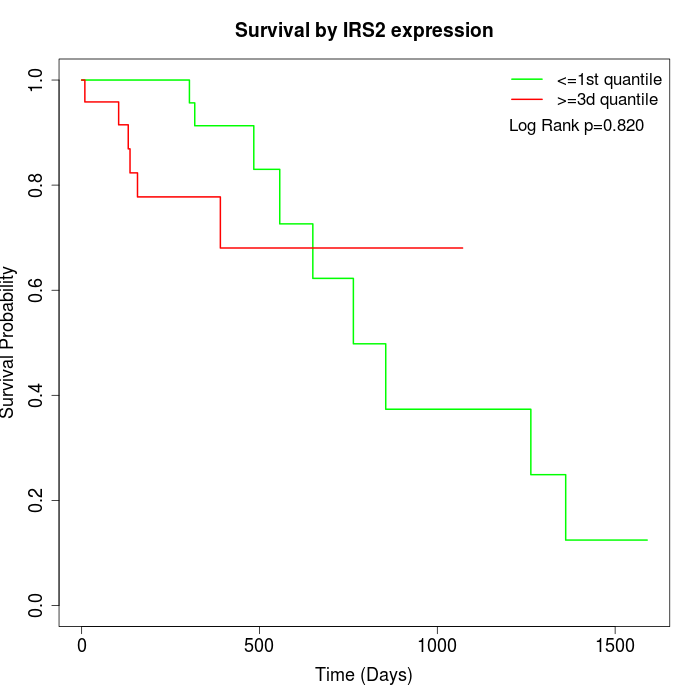 |
| GSE53622 | GSE53624 | TCGA |
Note: Click image to view full size file.
Copy number change of IRS2:
| Dataset | Gene | EntrezID | Gain | Loss | Normal | Detail |
|---|---|---|---|---|---|---|
| GSE15526 | IRS2 | 8660 | 7 | 11 | 12 | |
| GSE20123 | IRS2 | 8660 | 7 | 10 | 13 | |
| GSE43470 | IRS2 | 8660 | 4 | 13 | 26 | |
| GSE46452 | IRS2 | 8660 | 2 | 31 | 26 | |
| GSE47630 | IRS2 | 8660 | 3 | 26 | 11 | |
| GSE54993 | IRS2 | 8660 | 11 | 4 | 55 | |
| GSE54994 | IRS2 | 8660 | 8 | 8 | 37 | |
| GSE60625 | IRS2 | 8660 | 0 | 3 | 8 | |
| GSE74703 | IRS2 | 8660 | 3 | 9 | 24 | |
| GSE74704 | IRS2 | 8660 | 4 | 9 | 7 | |
| TCGA | IRS2 | 8660 | 19 | 33 | 44 |
Total number of gains: 68; Total number of losses: 157; Total Number of normals: 263.
Somatic mutations of IRS2:
Generating mutation plots.
Highly correlated genes for IRS2:
Showing top 20/809 corelated genes with mean PCC>0.5.
| Gene1 | Gene2 | Mean PCC | Num. Datasets | Num. PCC<0 | Num. PCC>0.5 |
|---|---|---|---|---|---|
| IRS2 | RAD23A | 0.838236 | 3 | 0 | 3 |
| IRS2 | MYADM | 0.773998 | 4 | 0 | 4 |
| IRS2 | ZNF805 | 0.765274 | 3 | 0 | 3 |
| IRS2 | TPPP3 | 0.764777 | 3 | 0 | 3 |
| IRS2 | GOPC | 0.764559 | 3 | 0 | 3 |
| IRS2 | MUS81 | 0.759155 | 3 | 0 | 3 |
| IRS2 | MACROD2 | 0.757816 | 3 | 0 | 3 |
| IRS2 | FUNDC2 | 0.749514 | 4 | 0 | 3 |
| IRS2 | RNASE4 | 0.746046 | 4 | 0 | 4 |
| IRS2 | KIAA0895L | 0.744894 | 3 | 0 | 3 |
| IRS2 | MSI2 | 0.744484 | 4 | 0 | 4 |
| IRS2 | GPR3 | 0.74391 | 3 | 0 | 3 |
| IRS2 | EIF3G | 0.739565 | 4 | 0 | 3 |
| IRS2 | TNPO2 | 0.739179 | 3 | 0 | 3 |
| IRS2 | FHL1 | 0.732335 | 5 | 0 | 4 |
| IRS2 | IGFBP6 | 0.732058 | 3 | 0 | 3 |
| IRS2 | ASXL2 | 0.731353 | 3 | 0 | 3 |
| IRS2 | C3orf70 | 0.731071 | 4 | 0 | 3 |
| IRS2 | DPYSL3 | 0.726133 | 7 | 0 | 5 |
| IRS2 | IRF2BP2 | 0.724872 | 4 | 0 | 3 |
For details and further investigation, click here