| Full name: tryptophan hydroxylase 1 | Alias Symbol: | ||
| Type: protein-coding gene | Cytoband: 11p15.1 | ||
| Entrez ID: 7166 | HGNC ID: HGNC:12008 | Ensembl Gene: ENSG00000129167 | OMIM ID: 191060 |
| Related drugs: CHEMBL472222, FENCLONINE, FENFLURAMINE, ROPINIROLE, SAPROPTERIN, TELOTRISTAT, TELOTRISTAT ETHYL... [more] | |||
Expression of TPH1:
| Dataset | Gene | EntrezID | Probe | Log2FC | Adj.pValue | Expression |
|---|---|---|---|---|---|---|
| GSE17351 | TPH1 | 7166 | 231626_at | 0.1368 | 0.6528 | |
| GSE20347 | TPH1 | 7166 | 214601_at | -0.0359 | 0.5234 | |
| GSE23400 | TPH1 | 7166 | 214601_at | -0.0023 | 0.8930 | |
| GSE26886 | TPH1 | 7166 | 1553859_at | -0.0326 | 0.7726 | |
| GSE29001 | TPH1 | 7166 | 214601_at | 0.1162 | 0.4199 | |
| GSE38129 | TPH1 | 7166 | 214601_at | -0.0277 | 0.9295 | |
| GSE45670 | TPH1 | 7166 | 231626_at | 0.0857 | 0.3344 | |
| GSE53622 | TPH1 | 7166 | 134155 | 0.3647 | 0.0816 | |
| GSE53624 | TPH1 | 7166 | 134155 | -0.1029 | 0.4726 | |
| GSE63941 | TPH1 | 7166 | 231626_at | 0.2396 | 0.1002 | |
| GSE77861 | TPH1 | 7166 | 1553859_at | -0.0204 | 0.8460 | |
| GSE97050 | TPH1 | 7166 | A_23_P150595 | -0.0033 | 0.9898 | |
| SRP064894 | TPH1 | 7166 | RNAseq | 0.1604 | 0.5275 | |
| SRP133303 | TPH1 | 7166 | RNAseq | -0.0641 | 0.7065 | |
| SRP159526 | TPH1 | 7166 | RNAseq | 0.7147 | 0.2177 | |
| SRP193095 | TPH1 | 7166 | RNAseq | -0.3418 | 0.3146 | |
| SRP219564 | TPH1 | 7166 | RNAseq | 1.0500 | 0.1929 | |
| TCGA | TPH1 | 7166 | RNAseq | -2.5420 | 0.0000 |
Upregulated datasets: 0; Downregulated datasets: 1.
Survival by TPH1 expression:
 | 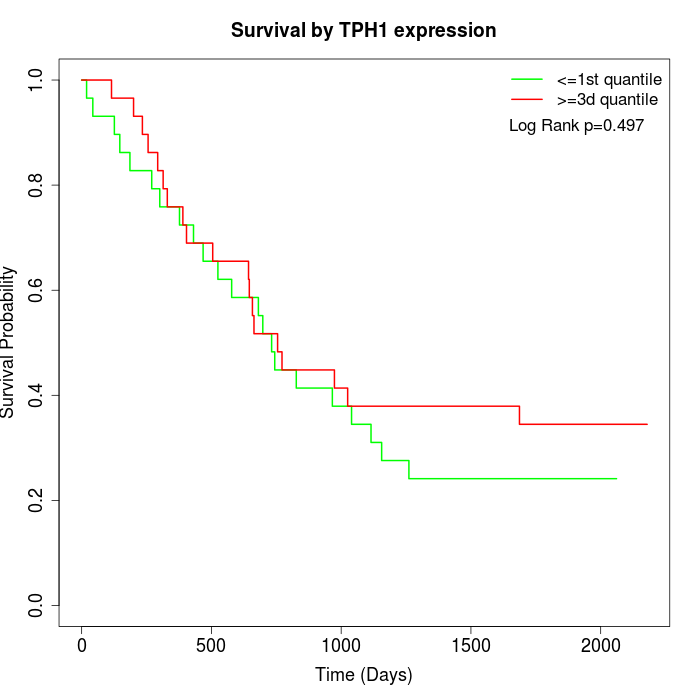 | 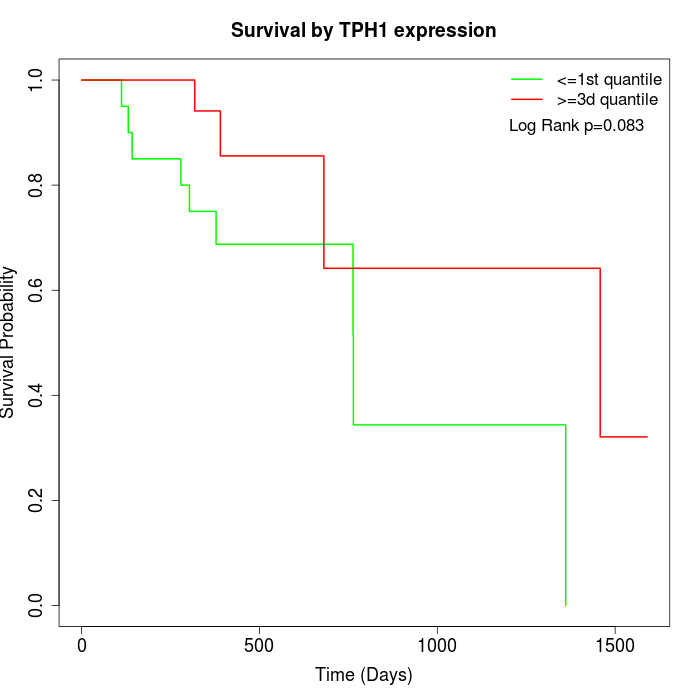 |
| GSE53622 | GSE53624 | TCGA |
Note: Click image to view full size file.
Copy number change of TPH1:
| Dataset | Gene | EntrezID | Gain | Loss | Normal | Detail |
|---|---|---|---|---|---|---|
| GSE15526 | TPH1 | 7166 | 0 | 10 | 20 | |
| GSE20123 | TPH1 | 7166 | 0 | 10 | 20 | |
| GSE43470 | TPH1 | 7166 | 1 | 5 | 37 | |
| GSE46452 | TPH1 | 7166 | 7 | 5 | 47 | |
| GSE47630 | TPH1 | 7166 | 3 | 10 | 27 | |
| GSE54993 | TPH1 | 7166 | 3 | 0 | 67 | |
| GSE54994 | TPH1 | 7166 | 3 | 12 | 38 | |
| GSE60625 | TPH1 | 7166 | 0 | 0 | 11 | |
| GSE74703 | TPH1 | 7166 | 1 | 3 | 32 | |
| GSE74704 | TPH1 | 7166 | 0 | 9 | 11 | |
| TCGA | TPH1 | 7166 | 11 | 29 | 56 |
Total number of gains: 29; Total number of losses: 93; Total Number of normals: 366.
Somatic mutations of TPH1:
Generating mutation plots.
Highly correlated genes for TPH1:
Showing top 20/41 corelated genes with mean PCC>0.5.
| Gene1 | Gene2 | Mean PCC | Num. Datasets | Num. PCC<0 | Num. PCC>0.5 |
|---|---|---|---|---|---|
| TPH1 | INSM1 | 0.736435 | 3 | 0 | 3 |
| TPH1 | CEMP1 | 0.72536 | 3 | 0 | 3 |
| TPH1 | KIF17 | 0.697683 | 3 | 0 | 3 |
| TPH1 | GABRB1 | 0.686399 | 4 | 0 | 4 |
| TPH1 | CRABP1 | 0.66865 | 3 | 0 | 3 |
| TPH1 | ZNF182 | 0.658385 | 3 | 0 | 3 |
| TPH1 | LGALS4 | 0.651131 | 3 | 0 | 3 |
| TPH1 | CNGB1 | 0.644158 | 3 | 0 | 3 |
| TPH1 | ZNF620 | 0.641206 | 3 | 0 | 3 |
| TPH1 | FCHSD1 | 0.639101 | 3 | 0 | 3 |
| TPH1 | CDX2 | 0.638395 | 3 | 0 | 3 |
| TPH1 | TRIM36 | 0.63761 | 3 | 0 | 3 |
| TPH1 | SOX30 | 0.634214 | 4 | 0 | 4 |
| TPH1 | BTBD8 | 0.632147 | 4 | 0 | 3 |
| TPH1 | HNRNPK | 0.625303 | 3 | 0 | 3 |
| TPH1 | LMAN1L | 0.617132 | 3 | 0 | 3 |
| TPH1 | LRCH4 | 0.614636 | 3 | 0 | 3 |
| TPH1 | LY6H | 0.612377 | 3 | 0 | 3 |
| TPH1 | POLL | 0.609591 | 3 | 0 | 3 |
| TPH1 | MAT1A | 0.597672 | 4 | 0 | 3 |
For details and further investigation, click here