| Full name: cellular retinoic acid binding protein 1 | Alias Symbol: CRABP|CRABP-I|CRABPI | ||
| Type: protein-coding gene | Cytoband: 15q25.1 | ||
| Entrez ID: 1381 | HGNC ID: HGNC:2338 | Ensembl Gene: ENSG00000166426 | OMIM ID: 180230 |
Expression of CRABP1:
| Dataset | Gene | EntrezID | Probe | Log2FC | Adj.pValue | Expression |
|---|---|---|---|---|---|---|
| GSE17351 | CRABP1 | 1381 | 205350_at | 0.1038 | 0.6532 | |
| GSE20347 | CRABP1 | 1381 | 205350_at | 0.0120 | 0.9182 | |
| GSE23400 | CRABP1 | 1381 | 205350_at | -0.0680 | 0.0711 | |
| GSE26886 | CRABP1 | 1381 | 205350_at | 0.2498 | 0.0754 | |
| GSE29001 | CRABP1 | 1381 | 205350_at | 0.1212 | 0.5533 | |
| GSE38129 | CRABP1 | 1381 | 205350_at | 0.0045 | 0.9845 | |
| GSE45670 | CRABP1 | 1381 | 205350_at | 0.1567 | 0.0813 | |
| GSE53622 | CRABP1 | 1381 | 50476 | 0.6755 | 0.0000 | |
| GSE53624 | CRABP1 | 1381 | 50476 | 0.3561 | 0.0004 | |
| GSE63941 | CRABP1 | 1381 | 205350_at | 0.5721 | 0.5672 | |
| GSE77861 | CRABP1 | 1381 | 205350_at | 0.0999 | 0.5120 | |
| GSE97050 | CRABP1 | 1381 | A_33_P3216869 | -0.0947 | 0.8039 | |
| TCGA | CRABP1 | 1381 | RNAseq | -0.7286 | 0.3641 |
Upregulated datasets: 0; Downregulated datasets: 0.
Survival by CRABP1 expression:
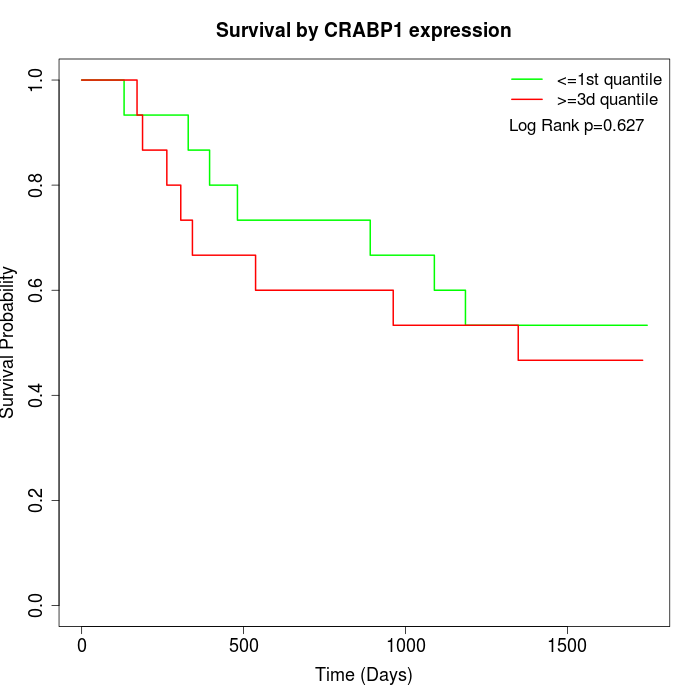 | 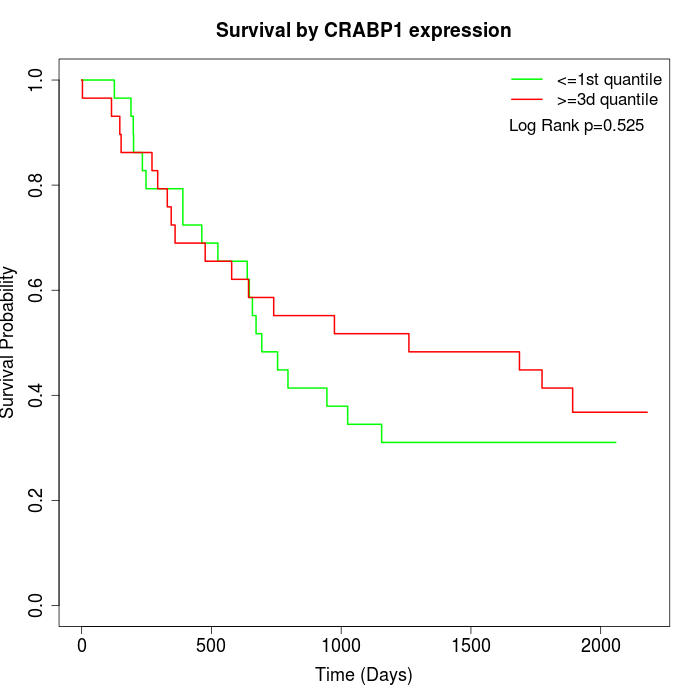 | 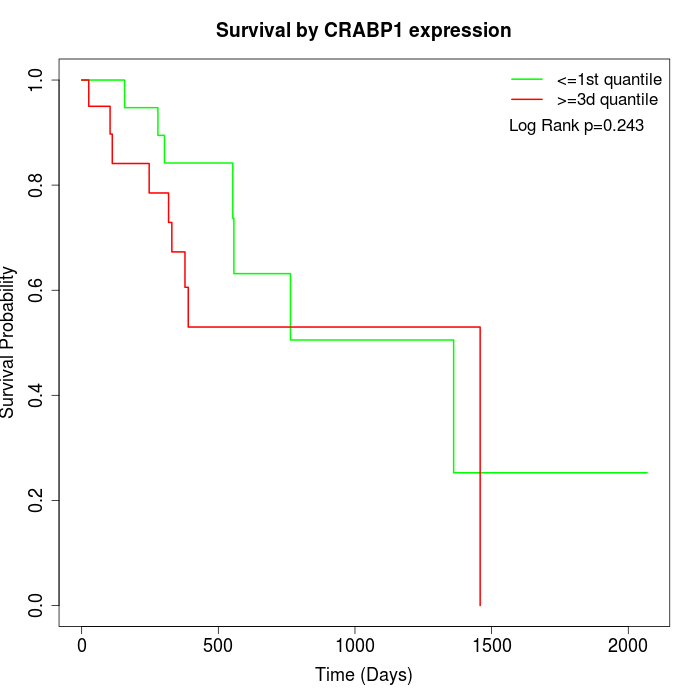 |
| GSE53622 | GSE53624 | TCGA |
Note: Click image to view full size file.
Copy number change of CRABP1:
| Dataset | Gene | EntrezID | Gain | Loss | Normal | Detail |
|---|---|---|---|---|---|---|
| GSE15526 | CRABP1 | 1381 | 7 | 1 | 22 | |
| GSE20123 | CRABP1 | 1381 | 7 | 1 | 22 | |
| GSE43470 | CRABP1 | 1381 | 4 | 5 | 34 | |
| GSE46452 | CRABP1 | 1381 | 3 | 7 | 49 | |
| GSE47630 | CRABP1 | 1381 | 8 | 10 | 22 | |
| GSE54993 | CRABP1 | 1381 | 5 | 6 | 59 | |
| GSE54994 | CRABP1 | 1381 | 5 | 6 | 42 | |
| GSE60625 | CRABP1 | 1381 | 4 | 0 | 7 | |
| GSE74703 | CRABP1 | 1381 | 4 | 3 | 29 | |
| GSE74704 | CRABP1 | 1381 | 3 | 1 | 16 | |
| TCGA | CRABP1 | 1381 | 14 | 15 | 67 |
Total number of gains: 64; Total number of losses: 55; Total Number of normals: 369.
Somatic mutations of CRABP1:
Generating mutation plots.
Highly correlated genes for CRABP1:
Showing top 20/216 corelated genes with mean PCC>0.5.
| Gene1 | Gene2 | Mean PCC | Num. Datasets | Num. PCC<0 | Num. PCC>0.5 |
|---|---|---|---|---|---|
| CRABP1 | QPRT | 0.756221 | 4 | 0 | 4 |
| CRABP1 | LMF1 | 0.751772 | 3 | 0 | 3 |
| CRABP1 | MEGF10 | 0.735808 | 3 | 0 | 3 |
| CRABP1 | IGFL2 | 0.731794 | 3 | 0 | 3 |
| CRABP1 | ATP7B | 0.731123 | 4 | 0 | 4 |
| CRABP1 | TNF | 0.729644 | 3 | 0 | 3 |
| CRABP1 | GPR150 | 0.727869 | 3 | 0 | 3 |
| CRABP1 | ORM1 | 0.724327 | 3 | 0 | 3 |
| CRABP1 | GABRB1 | 0.719718 | 4 | 0 | 3 |
| CRABP1 | FASLG | 0.718 | 3 | 0 | 3 |
| CRABP1 | LIM2 | 0.712792 | 3 | 0 | 3 |
| CRABP1 | SPIB | 0.709264 | 3 | 0 | 3 |
| CRABP1 | OR7A17 | 0.707621 | 4 | 0 | 3 |
| CRABP1 | CDH4 | 0.706391 | 3 | 0 | 3 |
| CRABP1 | CTSE | 0.705939 | 4 | 0 | 3 |
| CRABP1 | POLM | 0.686256 | 4 | 0 | 4 |
| CRABP1 | SCAMP5 | 0.68614 | 4 | 0 | 4 |
| CRABP1 | BEST2 | 0.682161 | 4 | 0 | 4 |
| CRABP1 | MEGF11 | 0.680148 | 3 | 0 | 3 |
| CRABP1 | AGAP2 | 0.678112 | 4 | 0 | 3 |
For details and further investigation, click here