| Full name: thiamin pyrophosphokinase 1 | Alias Symbol: HTPK1|PP20 | ||
| Type: protein-coding gene | Cytoband: 7q35 | ||
| Entrez ID: 27010 | HGNC ID: HGNC:17358 | Ensembl Gene: ENSG00000196511 | OMIM ID: 606370 |
Screen Evidence:
| |||
Expression of TPK1:
| Dataset | Gene | EntrezID | Probe | Log2FC | Adj.pValue | Expression |
|---|---|---|---|---|---|---|
| GSE17351 | TPK1 | 27010 | 221218_s_at | -0.3223 | 0.7105 | |
| GSE20347 | TPK1 | 27010 | 221218_s_at | -0.0216 | 0.8847 | |
| GSE23400 | TPK1 | 27010 | 221218_s_at | 0.0342 | 0.5277 | |
| GSE26886 | TPK1 | 27010 | 221218_s_at | -0.4815 | 0.1030 | |
| GSE29001 | TPK1 | 27010 | 221218_s_at | 0.0869 | 0.8295 | |
| GSE38129 | TPK1 | 27010 | 221218_s_at | -0.2145 | 0.3278 | |
| GSE45670 | TPK1 | 27010 | 221218_s_at | -0.2492 | 0.3286 | |
| GSE53622 | TPK1 | 27010 | 86424 | -0.2177 | 0.0082 | |
| GSE53624 | TPK1 | 27010 | 86424 | -0.0536 | 0.5558 | |
| GSE63941 | TPK1 | 27010 | 221218_s_at | -1.2246 | 0.1919 | |
| GSE77861 | TPK1 | 27010 | 221218_s_at | -0.0802 | 0.5527 | |
| GSE97050 | TPK1 | 27010 | A_23_P145957 | -0.0016 | 0.9951 | |
| SRP007169 | TPK1 | 27010 | RNAseq | 1.3014 | 0.0955 | |
| SRP064894 | TPK1 | 27010 | RNAseq | 0.4428 | 0.0997 | |
| SRP133303 | TPK1 | 27010 | RNAseq | 0.0833 | 0.6549 | |
| SRP159526 | TPK1 | 27010 | RNAseq | -0.6139 | 0.2852 | |
| SRP193095 | TPK1 | 27010 | RNAseq | -0.5147 | 0.0869 | |
| SRP219564 | TPK1 | 27010 | RNAseq | 0.0901 | 0.8648 | |
| TCGA | TPK1 | 27010 | RNAseq | -0.5248 | 0.0005 |
Upregulated datasets: 0; Downregulated datasets: 0.
Survival by TPK1 expression:
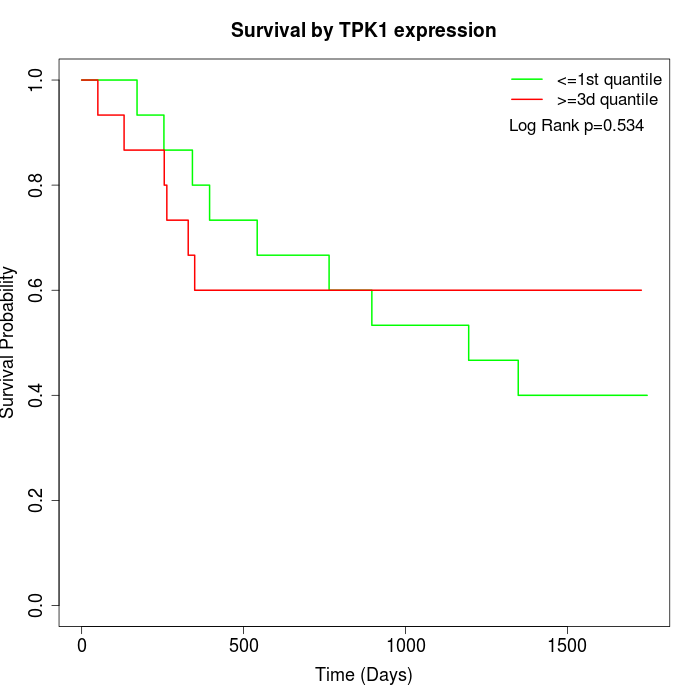 | 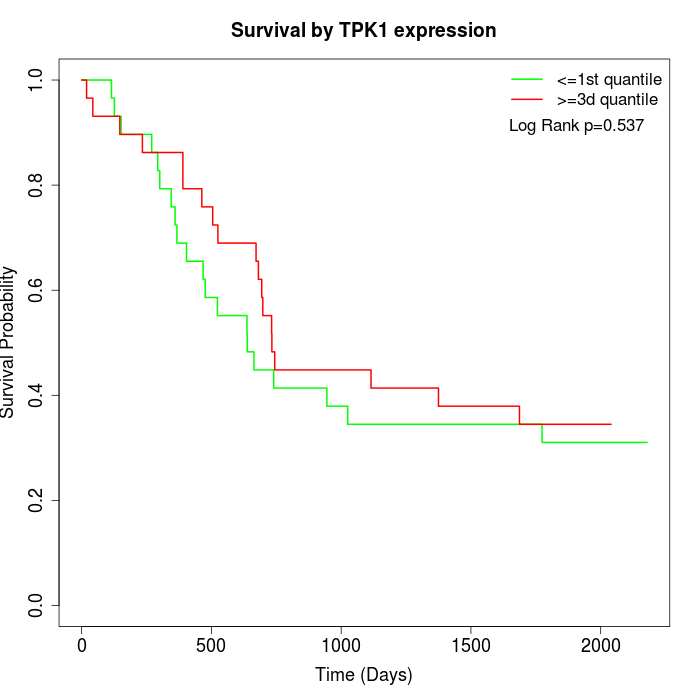 | 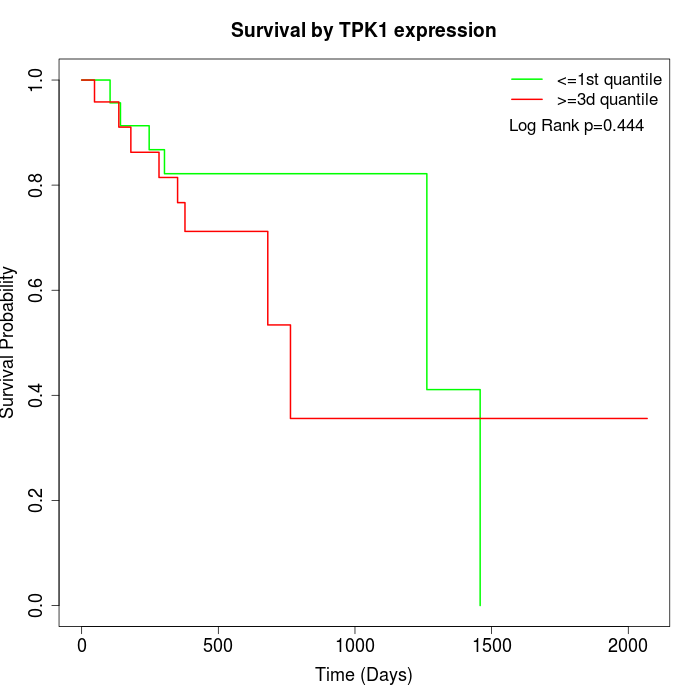 |
| GSE53622 | GSE53624 | TCGA |
Note: Click image to view full size file.
Copy number change of TPK1:
| Dataset | Gene | EntrezID | Gain | Loss | Normal | Detail |
|---|---|---|---|---|---|---|
| GSE15526 | TPK1 | 27010 | 3 | 3 | 24 | |
| GSE20123 | TPK1 | 27010 | 3 | 3 | 24 | |
| GSE43470 | TPK1 | 27010 | 3 | 5 | 35 | |
| GSE46452 | TPK1 | 27010 | 7 | 2 | 50 | |
| GSE47630 | TPK1 | 27010 | 6 | 8 | 26 | |
| GSE54993 | TPK1 | 27010 | 3 | 4 | 63 | |
| GSE54994 | TPK1 | 27010 | 5 | 8 | 40 | |
| GSE60625 | TPK1 | 27010 | 0 | 0 | 11 | |
| GSE74703 | TPK1 | 27010 | 2 | 5 | 29 | |
| GSE74704 | TPK1 | 27010 | 1 | 3 | 16 | |
| TCGA | TPK1 | 27010 | 26 | 27 | 43 |
Total number of gains: 59; Total number of losses: 68; Total Number of normals: 361.
Somatic mutations of TPK1:
Generating mutation plots.
Highly correlated genes for TPK1:
Showing top 20/369 corelated genes with mean PCC>0.5.
| Gene1 | Gene2 | Mean PCC | Num. Datasets | Num. PCC<0 | Num. PCC>0.5 |
|---|---|---|---|---|---|
| TPK1 | EIF3L | 0.731238 | 3 | 0 | 3 |
| TPK1 | RNF183 | 0.686721 | 4 | 0 | 4 |
| TPK1 | SDC2 | 0.685394 | 3 | 0 | 3 |
| TPK1 | CACNA2D4 | 0.681352 | 3 | 0 | 3 |
| TPK1 | RABAC1 | 0.672746 | 4 | 0 | 4 |
| TPK1 | GIMAP5 | 0.664009 | 3 | 0 | 3 |
| TPK1 | SRPX | 0.654324 | 4 | 0 | 3 |
| TPK1 | CEP120 | 0.654058 | 3 | 0 | 3 |
| TPK1 | BEX5 | 0.652911 | 3 | 0 | 3 |
| TPK1 | MAPK10 | 0.65188 | 3 | 0 | 3 |
| TPK1 | ENPP2 | 0.649095 | 6 | 0 | 5 |
| TPK1 | MAPRE2 | 0.648752 | 6 | 0 | 5 |
| TPK1 | BMPR2 | 0.642106 | 5 | 0 | 3 |
| TPK1 | GNGT2 | 0.639531 | 4 | 0 | 3 |
| TPK1 | LSP1 | 0.638793 | 3 | 0 | 3 |
| TPK1 | DCAF10 | 0.635528 | 3 | 0 | 3 |
| TPK1 | TBC1D2B | 0.631623 | 3 | 0 | 3 |
| TPK1 | FOLR2 | 0.631555 | 6 | 0 | 3 |
| TPK1 | CCDC102B | 0.630016 | 4 | 0 | 3 |
| TPK1 | SLC46A3 | 0.628823 | 9 | 0 | 7 |
For details and further investigation, click here