| Full name: tetraspanin 9 | Alias Symbol: NET-5 | ||
| Type: protein-coding gene | Cytoband: 12p13.33-p13.32 | ||
| Entrez ID: 10867 | HGNC ID: HGNC:21640 | Ensembl Gene: ENSG00000011105 | OMIM ID: 613137 |
Expression of TSPAN9:
| Dataset | Gene | EntrezID | Probe | Log2FC | Adj.pValue | Expression |
|---|---|---|---|---|---|---|
| GSE17351 | TSPAN9 | 10867 | 220968_s_at | 0.4323 | 0.1651 | |
| GSE20347 | TSPAN9 | 10867 | 220968_s_at | 0.3742 | 0.0004 | |
| GSE23400 | TSPAN9 | 10867 | 220968_s_at | 0.2006 | 0.0010 | |
| GSE26886 | TSPAN9 | 10867 | 220968_s_at | 0.6329 | 0.0020 | |
| GSE29001 | TSPAN9 | 10867 | 220968_s_at | 0.4429 | 0.0199 | |
| GSE38129 | TSPAN9 | 10867 | 220968_s_at | 0.3293 | 0.0006 | |
| GSE45670 | TSPAN9 | 10867 | 220968_s_at | 0.2576 | 0.0681 | |
| GSE53622 | TSPAN9 | 10867 | 55093 | 0.7650 | 0.0000 | |
| GSE53624 | TSPAN9 | 10867 | 55093 | 0.9020 | 0.0000 | |
| GSE63941 | TSPAN9 | 10867 | 220968_s_at | -0.3529 | 0.3610 | |
| GSE77861 | TSPAN9 | 10867 | 220968_s_at | 0.0118 | 0.9441 | |
| GSE97050 | TSPAN9 | 10867 | A_23_P151133 | -0.1125 | 0.7592 | |
| SRP007169 | TSPAN9 | 10867 | RNAseq | 0.6516 | 0.0904 | |
| SRP008496 | TSPAN9 | 10867 | RNAseq | 0.7076 | 0.0172 | |
| SRP064894 | TSPAN9 | 10867 | RNAseq | 0.7012 | 0.0001 | |
| SRP133303 | TSPAN9 | 10867 | RNAseq | 0.7335 | 0.0052 | |
| SRP159526 | TSPAN9 | 10867 | RNAseq | 0.2818 | 0.1057 | |
| SRP193095 | TSPAN9 | 10867 | RNAseq | 0.7633 | 0.0004 | |
| SRP219564 | TSPAN9 | 10867 | RNAseq | 0.3379 | 0.3126 | |
| TCGA | TSPAN9 | 10867 | RNAseq | 0.2014 | 0.0040 |
Upregulated datasets: 0; Downregulated datasets: 0.
Survival by TSPAN9 expression:
 | 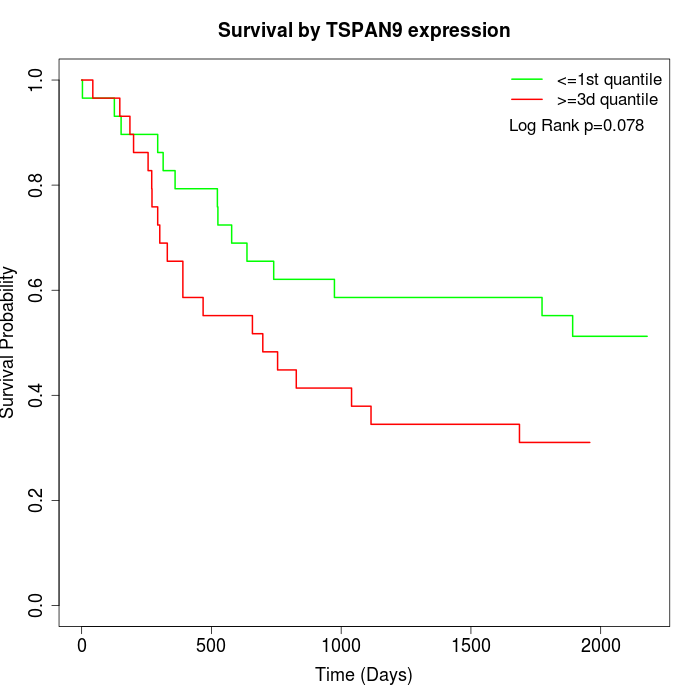 | 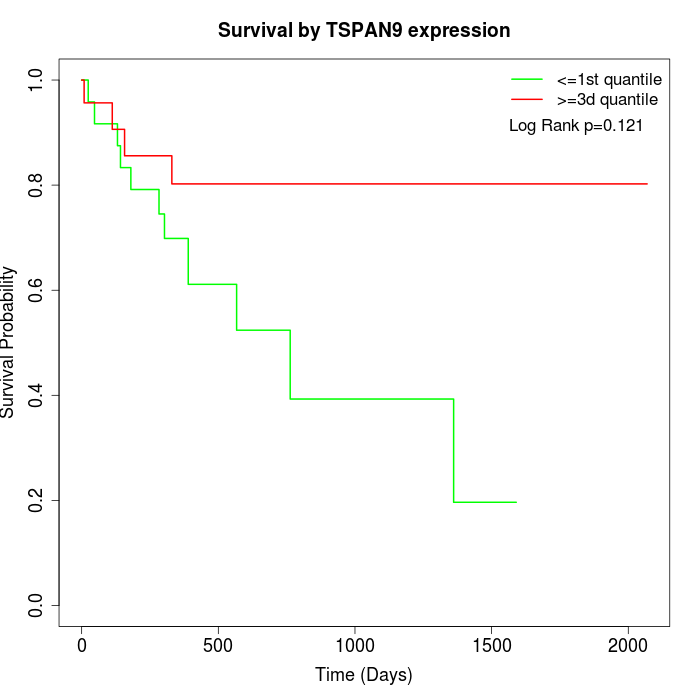 |
| GSE53622 | GSE53624 | TCGA |
Note: Click image to view full size file.
Copy number change of TSPAN9:
| Dataset | Gene | EntrezID | Gain | Loss | Normal | Detail |
|---|---|---|---|---|---|---|
| GSE15526 | TSPAN9 | 10867 | 6 | 4 | 20 | |
| GSE20123 | TSPAN9 | 10867 | 6 | 4 | 20 | |
| GSE43470 | TSPAN9 | 10867 | 10 | 3 | 30 | |
| GSE46452 | TSPAN9 | 10867 | 10 | 1 | 48 | |
| GSE47630 | TSPAN9 | 10867 | 12 | 2 | 26 | |
| GSE54993 | TSPAN9 | 10867 | 1 | 10 | 59 | |
| GSE54994 | TSPAN9 | 10867 | 10 | 2 | 41 | |
| GSE60625 | TSPAN9 | 10867 | 0 | 1 | 10 | |
| GSE74703 | TSPAN9 | 10867 | 9 | 2 | 25 | |
| GSE74704 | TSPAN9 | 10867 | 4 | 2 | 14 | |
| TCGA | TSPAN9 | 10867 | 40 | 6 | 50 |
Total number of gains: 108; Total number of losses: 37; Total Number of normals: 343.
Somatic mutations of TSPAN9:
Generating mutation plots.
Highly correlated genes for TSPAN9:
Showing top 20/1062 corelated genes with mean PCC>0.5.
| Gene1 | Gene2 | Mean PCC | Num. Datasets | Num. PCC<0 | Num. PCC>0.5 |
|---|---|---|---|---|---|
| TSPAN9 | APOBR | 0.813249 | 3 | 0 | 3 |
| TSPAN9 | SAMM50 | 0.806479 | 3 | 0 | 3 |
| TSPAN9 | TMEM69 | 0.758936 | 3 | 0 | 3 |
| TSPAN9 | ZNF317 | 0.746975 | 3 | 0 | 3 |
| TSPAN9 | LRRK1 | 0.740203 | 3 | 0 | 3 |
| TSPAN9 | CD86 | 0.725384 | 3 | 0 | 3 |
| TSPAN9 | BNIP1 | 0.723505 | 3 | 0 | 3 |
| TSPAN9 | BIRC6 | 0.722343 | 3 | 0 | 3 |
| TSPAN9 | FAM167B | 0.71794 | 3 | 0 | 3 |
| TSPAN9 | KTI12 | 0.70947 | 3 | 0 | 3 |
| TSPAN9 | ST8SIA4 | 0.706581 | 3 | 0 | 3 |
| TSPAN9 | SNX20 | 0.706225 | 3 | 0 | 3 |
| TSPAN9 | TRAF7 | 0.705503 | 3 | 0 | 3 |
| TSPAN9 | HIBADH | 0.704927 | 3 | 0 | 3 |
| TSPAN9 | NSUN3 | 0.704226 | 3 | 0 | 3 |
| TSPAN9 | TADA2A | 0.701667 | 3 | 0 | 3 |
| TSPAN9 | USF2 | 0.701222 | 3 | 0 | 3 |
| TSPAN9 | RAB34 | 0.70005 | 3 | 0 | 3 |
| TSPAN9 | SPON2 | 0.698352 | 3 | 0 | 3 |
| TSPAN9 | CD163L1 | 0.69832 | 3 | 0 | 3 |
For details and further investigation, click here