| Full name: BCL2 interacting protein 1 | Alias Symbol: Nip1|SEC20 | ||
| Type: protein-coding gene | Cytoband: 5q35.1 | ||
| Entrez ID: 662 | HGNC ID: HGNC:1082 | Ensembl Gene: ENSG00000113734 | OMIM ID: 603291 |
Screen Evidence:
| |||
Expression of BNIP1:
| Dataset | Gene | EntrezID | Probe | Log2FC | Adj.pValue | Expression |
|---|---|---|---|---|---|---|
| GSE17351 | BNIP1 | 662 | 204930_s_at | 0.0175 | 0.9592 | |
| GSE20347 | BNIP1 | 662 | 204930_s_at | 0.0008 | 0.9944 | |
| GSE23400 | BNIP1 | 662 | 204930_s_at | -0.0878 | 0.0009 | |
| GSE26886 | BNIP1 | 662 | 204930_s_at | 0.1486 | 0.3201 | |
| GSE29001 | BNIP1 | 662 | 204930_s_at | -0.0165 | 0.9201 | |
| GSE38129 | BNIP1 | 662 | 204930_s_at | 0.0033 | 0.9732 | |
| GSE45670 | BNIP1 | 662 | 204930_s_at | 0.0709 | 0.6169 | |
| GSE53622 | BNIP1 | 662 | 74352 | 0.0729 | 0.3127 | |
| GSE53624 | BNIP1 | 662 | 74352 | 0.1091 | 0.2858 | |
| GSE63941 | BNIP1 | 662 | 207829_s_at | 0.7117 | 0.0885 | |
| GSE77861 | BNIP1 | 662 | 204930_s_at | -0.1534 | 0.1930 | |
| GSE97050 | BNIP1 | 662 | A_23_P7655 | 0.1869 | 0.4240 | |
| SRP007169 | BNIP1 | 662 | RNAseq | -0.0603 | 0.8939 | |
| SRP064894 | BNIP1 | 662 | RNAseq | 0.3140 | 0.1950 | |
| SRP133303 | BNIP1 | 662 | RNAseq | 0.3024 | 0.0965 | |
| SRP159526 | BNIP1 | 662 | RNAseq | -0.0583 | 0.8164 | |
| SRP193095 | BNIP1 | 662 | RNAseq | -0.2216 | 0.0765 | |
| SRP219564 | BNIP1 | 662 | RNAseq | 0.4056 | 0.2502 | |
| TCGA | BNIP1 | 662 | RNAseq | 0.0541 | 0.4548 |
Upregulated datasets: 0; Downregulated datasets: 0.
Survival by BNIP1 expression:
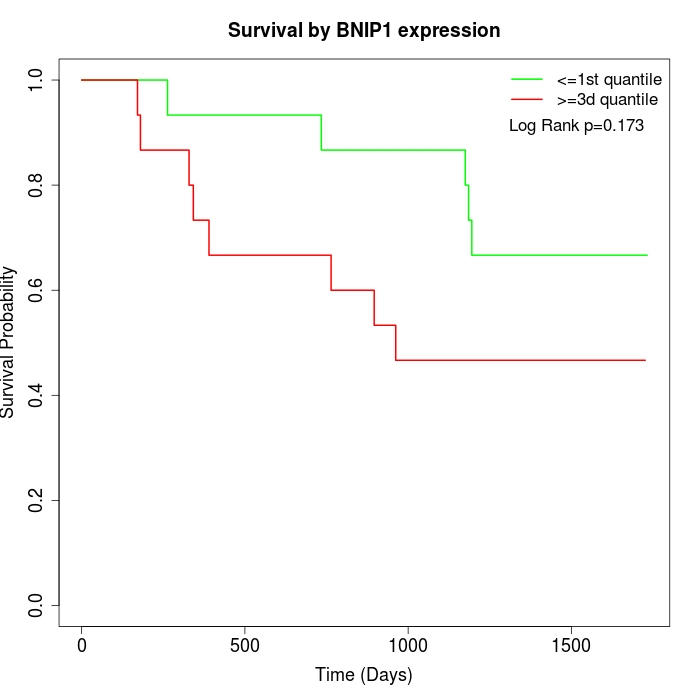 | 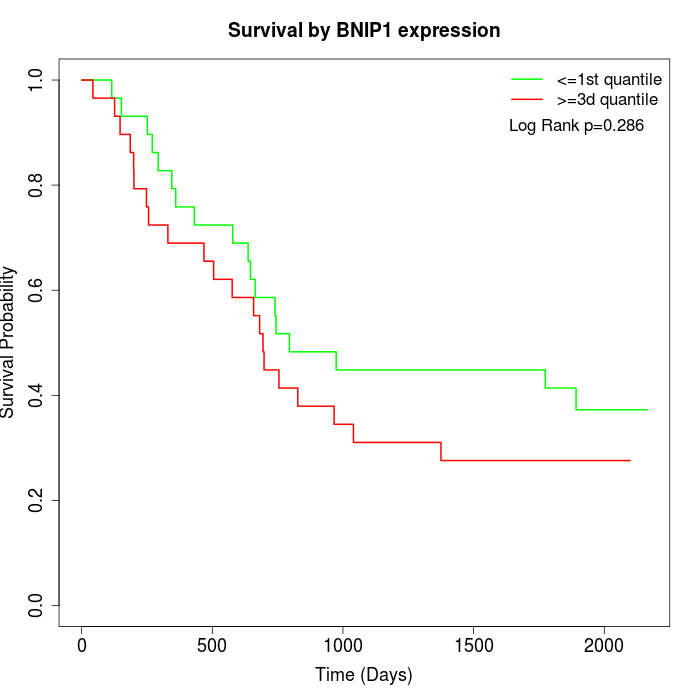 | 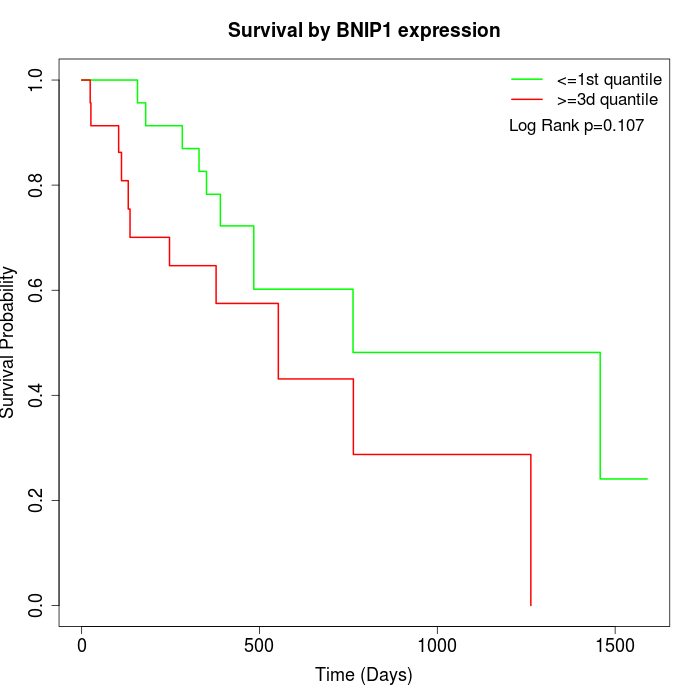 |
| GSE53622 | GSE53624 | TCGA |
Note: Click image to view full size file.
Copy number change of BNIP1:
| Dataset | Gene | EntrezID | Gain | Loss | Normal | Detail |
|---|---|---|---|---|---|---|
| GSE15526 | BNIP1 | 662 | 2 | 12 | 16 | |
| GSE20123 | BNIP1 | 662 | 2 | 12 | 16 | |
| GSE43470 | BNIP1 | 662 | 2 | 10 | 31 | |
| GSE46452 | BNIP1 | 662 | 0 | 27 | 32 | |
| GSE47630 | BNIP1 | 662 | 0 | 20 | 20 | |
| GSE54993 | BNIP1 | 662 | 9 | 2 | 59 | |
| GSE54994 | BNIP1 | 662 | 2 | 15 | 36 | |
| GSE60625 | BNIP1 | 662 | 1 | 0 | 10 | |
| GSE74703 | BNIP1 | 662 | 2 | 7 | 27 | |
| GSE74704 | BNIP1 | 662 | 1 | 6 | 13 | |
| TCGA | BNIP1 | 662 | 8 | 34 | 54 |
Total number of gains: 29; Total number of losses: 145; Total Number of normals: 314.
Somatic mutations of BNIP1:
Generating mutation plots.
Highly correlated genes for BNIP1:
Showing top 20/177 corelated genes with mean PCC>0.5.
| Gene1 | Gene2 | Mean PCC | Num. Datasets | Num. PCC<0 | Num. PCC>0.5 |
|---|---|---|---|---|---|
| BNIP1 | GNGT2 | 0.746055 | 3 | 0 | 3 |
| BNIP1 | CRADD | 0.733191 | 3 | 0 | 3 |
| BNIP1 | ZNF543 | 0.727575 | 3 | 0 | 3 |
| BNIP1 | TSPAN9 | 0.723505 | 3 | 0 | 3 |
| BNIP1 | HSPBP1 | 0.71203 | 4 | 0 | 3 |
| BNIP1 | C7orf50 | 0.709905 | 3 | 0 | 3 |
| BNIP1 | HTRA2 | 0.706516 | 3 | 0 | 3 |
| BNIP1 | MRPL38 | 0.70017 | 3 | 0 | 3 |
| BNIP1 | DEDD2 | 0.700087 | 3 | 0 | 3 |
| BNIP1 | TXNDC11 | 0.69844 | 3 | 0 | 3 |
| BNIP1 | PSMB8 | 0.698099 | 3 | 0 | 3 |
| BNIP1 | NAGA | 0.69335 | 3 | 0 | 3 |
| BNIP1 | MS4A6A | 0.690082 | 4 | 0 | 3 |
| BNIP1 | RPL26L1 | 0.67838 | 5 | 0 | 4 |
| BNIP1 | PNN | 0.675011 | 3 | 0 | 3 |
| BNIP1 | NLGN3 | 0.674325 | 4 | 0 | 3 |
| BNIP1 | PARVG | 0.668515 | 3 | 0 | 3 |
| BNIP1 | MUL1 | 0.667992 | 4 | 0 | 3 |
| BNIP1 | ZNF837 | 0.667053 | 3 | 0 | 3 |
| BNIP1 | NOP16 | 0.661531 | 7 | 0 | 7 |
For details and further investigation, click here