| Full name: ABRA C-terminal like | Alias Symbol: PRO2013|HSPC280|Costars | ||
| Type: protein-coding gene | Cytoband: 6q24.1 | ||
| Entrez ID: 58527 | HGNC ID: HGNC:21230 | Ensembl Gene: ENSG00000146386 | OMIM ID: |
Expression of ABRACL:
| Dataset | Gene | EntrezID | Probe | Log2FC | Adj.pValue | Expression |
|---|---|---|---|---|---|---|
| GSE17351 | ABRACL | 58527 | 223361_at | 0.8949 | 0.1733 | |
| GSE26886 | ABRACL | 58527 | 223361_at | 0.3833 | 0.1004 | |
| GSE45670 | ABRACL | 58527 | 223361_at | 0.7526 | 0.0003 | |
| GSE53622 | ABRACL | 58527 | 52110 | 0.4075 | 0.0002 | |
| GSE53624 | ABRACL | 58527 | 52110 | 0.5959 | 0.0000 | |
| GSE63941 | ABRACL | 58527 | 223361_at | 0.0708 | 0.9321 | |
| GSE77861 | ABRACL | 58527 | 223361_at | 0.1794 | 0.6234 | |
| SRP007169 | ABRACL | 58527 | RNAseq | 0.0998 | 0.8355 | |
| SRP008496 | ABRACL | 58527 | RNAseq | 0.2831 | 0.3629 | |
| SRP064894 | ABRACL | 58527 | RNAseq | 0.6461 | 0.0029 | |
| SRP133303 | ABRACL | 58527 | RNAseq | 0.6779 | 0.0015 | |
| SRP159526 | ABRACL | 58527 | RNAseq | 0.2341 | 0.5411 | |
| SRP193095 | ABRACL | 58527 | RNAseq | -0.1393 | 0.3026 | |
| SRP219564 | ABRACL | 58527 | RNAseq | 0.2097 | 0.6901 |
Upregulated datasets: 0; Downregulated datasets: 0.
Survival by ABRACL expression:
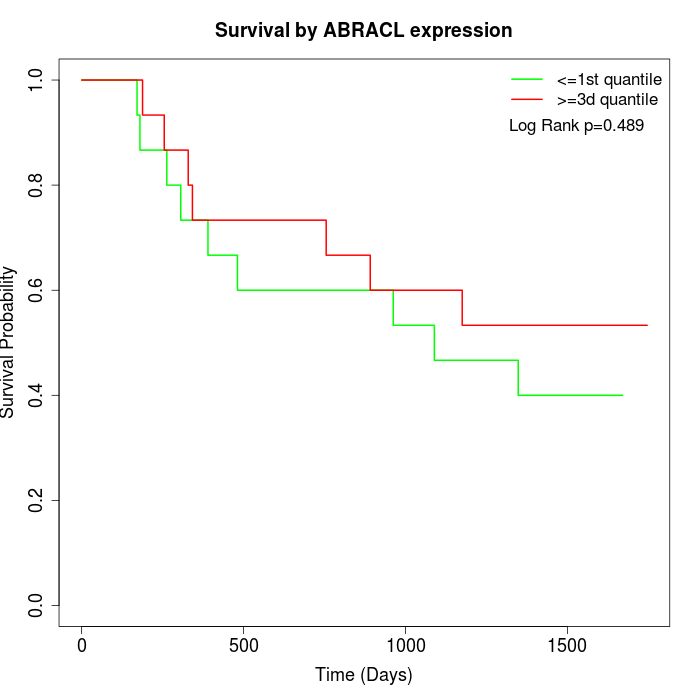 | 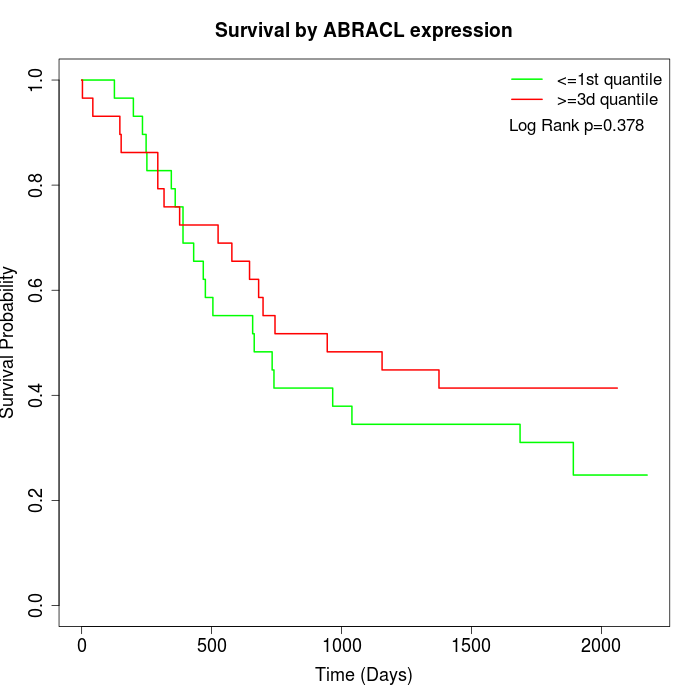 |
| GSE53622 | GSE53624 |
Note: Click image to view full size file.
Copy number change of ABRACL:
| Dataset | Gene | EntrezID | Gain | Loss | Normal | Detail |
|---|---|---|---|---|---|---|
| GSE15526 | ABRACL | 58527 | 2 | 4 | 24 | |
| GSE20123 | ABRACL | 58527 | 2 | 3 | 25 | |
| GSE43470 | ABRACL | 58527 | 5 | 0 | 38 | |
| GSE46452 | ABRACL | 58527 | 3 | 10 | 46 | |
| GSE47630 | ABRACL | 58527 | 9 | 4 | 27 | |
| GSE54993 | ABRACL | 58527 | 3 | 2 | 65 | |
| GSE54994 | ABRACL | 58527 | 8 | 8 | 37 | |
| GSE60625 | ABRACL | 58527 | 0 | 1 | 10 | |
| GSE74703 | ABRACL | 58527 | 4 | 0 | 32 | |
| GSE74704 | ABRACL | 58527 | 0 | 1 | 19 | |
| TCGA | ABRACL | 58527 | 11 | 18 | 67 |
Total number of gains: 47; Total number of losses: 51; Total Number of normals: 390.
Somatic mutations of ABRACL:
Generating mutation plots.
Highly correlated genes for ABRACL:
Showing top 20/322 corelated genes with mean PCC>0.5.
| Gene1 | Gene2 | Mean PCC | Num. Datasets | Num. PCC<0 | Num. PCC>0.5 |
|---|---|---|---|---|---|
| ABRACL | F11R | 0.712329 | 4 | 0 | 4 |
| ABRACL | TMF1 | 0.699669 | 3 | 0 | 3 |
| ABRACL | SCAMP3 | 0.672437 | 3 | 0 | 3 |
| ABRACL | BEND3 | 0.667942 | 3 | 0 | 3 |
| ABRACL | RCC2 | 0.667889 | 3 | 0 | 3 |
| ABRACL | TBC1D31 | 0.664872 | 4 | 0 | 4 |
| ABRACL | SLC35A2 | 0.662218 | 4 | 0 | 3 |
| ABRACL | CASP2 | 0.659605 | 4 | 0 | 4 |
| ABRACL | CDK16 | 0.650885 | 3 | 0 | 3 |
| ABRACL | ZBTB33 | 0.64869 | 3 | 0 | 3 |
| ABRACL | C12orf49 | 0.645402 | 4 | 0 | 3 |
| ABRACL | CKAP2 | 0.644056 | 4 | 0 | 4 |
| ABRACL | GRHL2 | 0.64146 | 4 | 0 | 3 |
| ABRACL | MRPS12 | 0.640986 | 3 | 0 | 3 |
| ABRACL | ASPM | 0.637903 | 6 | 0 | 6 |
| ABRACL | SGK1 | 0.637523 | 4 | 0 | 4 |
| ABRACL | LPAR2 | 0.633354 | 4 | 0 | 3 |
| ABRACL | STIL | 0.631081 | 4 | 0 | 4 |
| ABRACL | PTBP1 | 0.63043 | 5 | 0 | 4 |
| ABRACL | POLQ | 0.629057 | 4 | 0 | 4 |
For details and further investigation, click here