| Full name: triggering receptor expressed on myeloid cells 1 | Alias Symbol: TREM-1|CD354 | ||
| Type: protein-coding gene | Cytoband: 6p21.1 | ||
| Entrez ID: 54210 | HGNC ID: HGNC:17760 | Ensembl Gene: ENSG00000124731 | OMIM ID: 605085 |
Expression of TREM1:
| Dataset | Gene | EntrezID | Probe | Log2FC | Adj.pValue | Expression |
|---|---|---|---|---|---|---|
| GSE17351 | TREM1 | 54210 | 219434_at | 1.8778 | 0.0845 | |
| GSE20347 | TREM1 | 54210 | 219434_at | 0.4051 | 0.0017 | |
| GSE23400 | TREM1 | 54210 | 219434_at | 0.3693 | 0.0000 | |
| GSE26886 | TREM1 | 54210 | 219434_at | 1.0038 | 0.0073 | |
| GSE29001 | TREM1 | 54210 | 219434_at | 0.7826 | 0.0045 | |
| GSE38129 | TREM1 | 54210 | 219434_at | 0.6651 | 0.0006 | |
| GSE45670 | TREM1 | 54210 | 219434_at | 1.1769 | 0.0578 | |
| GSE53622 | TREM1 | 54210 | 68642 | 0.9949 | 0.0000 | |
| GSE53624 | TREM1 | 54210 | 68642 | 0.8353 | 0.0000 | |
| GSE63941 | TREM1 | 54210 | 219434_at | -0.0030 | 0.9961 | |
| GSE77861 | TREM1 | 54210 | 219434_at | 0.2758 | 0.0499 | |
| GSE97050 | TREM1 | 54210 | A_33_P3319905 | 0.0812 | 0.8646 | |
| SRP007169 | TREM1 | 54210 | RNAseq | 3.3741 | 0.0008 | |
| SRP064894 | TREM1 | 54210 | RNAseq | 2.4094 | 0.0000 | |
| SRP133303 | TREM1 | 54210 | RNAseq | 2.1298 | 0.0000 | |
| SRP159526 | TREM1 | 54210 | RNAseq | 3.2713 | 0.0000 | |
| SRP193095 | TREM1 | 54210 | RNAseq | 2.7606 | 0.0000 | |
| TCGA | TREM1 | 54210 | RNAseq | 2.0520 | 0.0000 |
Upregulated datasets: 7; Downregulated datasets: 0.
Survival by TREM1 expression:
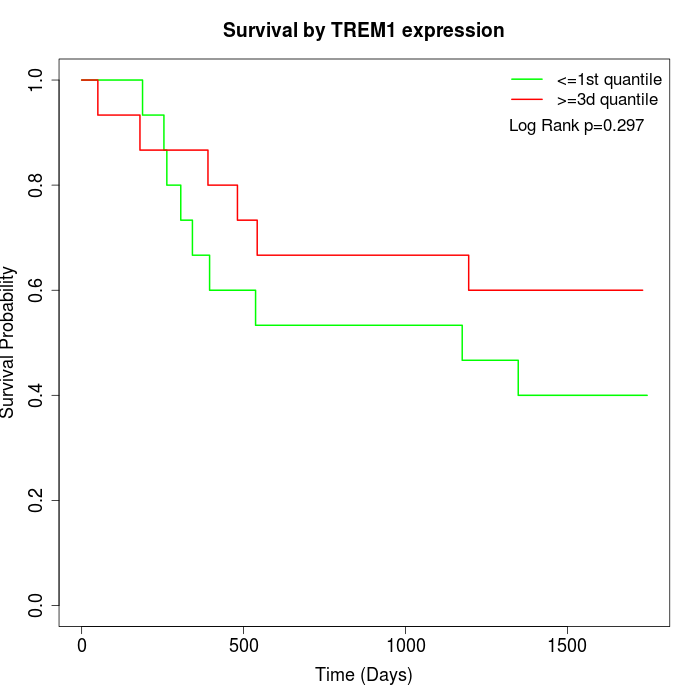 | 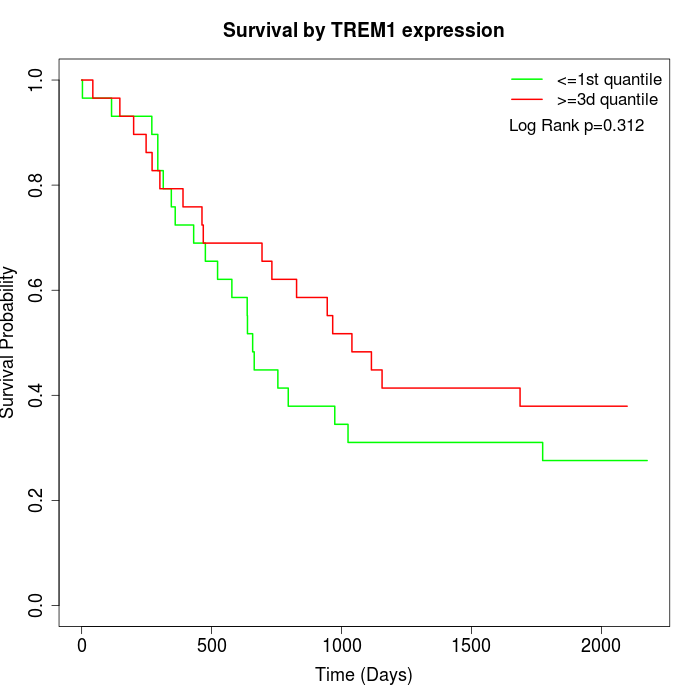 |  |
| GSE53622 | GSE53624 | TCGA |
Note: Click image to view full size file.
Copy number change of TREM1:
| Dataset | Gene | EntrezID | Gain | Loss | Normal | Detail |
|---|---|---|---|---|---|---|
| GSE15526 | TREM1 | 54210 | 5 | 2 | 23 | |
| GSE20123 | TREM1 | 54210 | 5 | 2 | 23 | |
| GSE43470 | TREM1 | 54210 | 6 | 0 | 37 | |
| GSE46452 | TREM1 | 54210 | 2 | 9 | 48 | |
| GSE47630 | TREM1 | 54210 | 8 | 4 | 28 | |
| GSE54993 | TREM1 | 54210 | 3 | 2 | 65 | |
| GSE54994 | TREM1 | 54210 | 11 | 4 | 38 | |
| GSE60625 | TREM1 | 54210 | 0 | 1 | 10 | |
| GSE74703 | TREM1 | 54210 | 6 | 0 | 30 | |
| GSE74704 | TREM1 | 54210 | 2 | 2 | 16 | |
| TCGA | TREM1 | 54210 | 20 | 13 | 63 |
Total number of gains: 68; Total number of losses: 39; Total Number of normals: 381.
Somatic mutations of TREM1:
Generating mutation plots.
Highly correlated genes for TREM1:
Showing top 20/373 corelated genes with mean PCC>0.5.
| Gene1 | Gene2 | Mean PCC | Num. Datasets | Num. PCC<0 | Num. PCC>0.5 |
|---|---|---|---|---|---|
| TREM1 | SCN1B | 0.783822 | 3 | 0 | 3 |
| TREM1 | SHC2 | 0.781448 | 3 | 0 | 3 |
| TREM1 | CCDC8 | 0.749666 | 3 | 0 | 3 |
| TREM1 | C1QL1 | 0.73463 | 3 | 0 | 3 |
| TREM1 | ANXA10 | 0.728989 | 4 | 0 | 4 |
| TREM1 | ZNF428 | 0.722219 | 3 | 0 | 3 |
| TREM1 | PLAUR | 0.719721 | 10 | 0 | 10 |
| TREM1 | TNNI1 | 0.704986 | 3 | 0 | 3 |
| TREM1 | RIMS4 | 0.70033 | 3 | 0 | 3 |
| TREM1 | LIN28B | 0.695696 | 4 | 0 | 3 |
| TREM1 | FBXO15 | 0.694053 | 3 | 0 | 3 |
| TREM1 | TOX2 | 0.693923 | 3 | 0 | 3 |
| TREM1 | FAP | 0.682624 | 8 | 0 | 7 |
| TREM1 | BMP10 | 0.680884 | 3 | 0 | 3 |
| TREM1 | SNAP25 | 0.679634 | 4 | 0 | 3 |
| TREM1 | WNT1 | 0.679143 | 3 | 0 | 3 |
| TREM1 | FAM155B | 0.677978 | 3 | 0 | 3 |
| TREM1 | FAM219A | 0.67654 | 4 | 0 | 3 |
| TREM1 | FAM189A1 | 0.674894 | 4 | 0 | 3 |
| TREM1 | ZNF446 | 0.674488 | 3 | 0 | 3 |
For details and further investigation, click here