| Full name: adaptor related protein complex 1 subunit mu 2 | Alias Symbol: HSMU1B|mu2|AP1-mu2 | ||
| Type: protein-coding gene | Cytoband: 19p13.2 | ||
| Entrez ID: 10053 | HGNC ID: HGNC:558 | Ensembl Gene: ENSG00000129354 | OMIM ID: 607309 |
Expression of AP1M2:
| Dataset | Gene | EntrezID | Probe | Log2FC | Adj.pValue | Expression |
|---|---|---|---|---|---|---|
| GSE17351 | AP1M2 | 10053 | 218261_at | 0.0830 | 0.9432 | |
| GSE20347 | AP1M2 | 10053 | 218261_at | -0.5958 | 0.0003 | |
| GSE23400 | AP1M2 | 10053 | 65517_at | -0.2145 | 0.0007 | |
| GSE26886 | AP1M2 | 10053 | 218261_at | -1.0106 | 0.0003 | |
| GSE29001 | AP1M2 | 10053 | 218261_at | -0.5312 | 0.0112 | |
| GSE38129 | AP1M2 | 10053 | 218261_at | -0.0878 | 0.7671 | |
| GSE45670 | AP1M2 | 10053 | 218261_at | 0.2353 | 0.2026 | |
| GSE53622 | AP1M2 | 10053 | 34482 | -0.3171 | 0.1574 | |
| GSE53624 | AP1M2 | 10053 | 34482 | -0.4886 | 0.0001 | |
| GSE63941 | AP1M2 | 10053 | 218261_at | 4.3858 | 0.0001 | |
| GSE77861 | AP1M2 | 10053 | 218261_at | 0.0663 | 0.8094 | |
| GSE97050 | AP1M2 | 10053 | A_23_P78543 | 0.3531 | 0.4527 | |
| SRP007169 | AP1M2 | 10053 | RNAseq | -1.3403 | 0.0001 | |
| SRP008496 | AP1M2 | 10053 | RNAseq | -1.2788 | 0.0000 | |
| SRP064894 | AP1M2 | 10053 | RNAseq | 0.1683 | 0.7412 | |
| SRP133303 | AP1M2 | 10053 | RNAseq | -0.2512 | 0.2309 | |
| SRP159526 | AP1M2 | 10053 | RNAseq | -0.1156 | 0.5495 | |
| SRP193095 | AP1M2 | 10053 | RNAseq | -0.7766 | 0.0000 | |
| SRP219564 | AP1M2 | 10053 | RNAseq | 0.2072 | 0.8564 | |
| TCGA | AP1M2 | 10053 | RNAseq | 0.0687 | 0.7034 |
Upregulated datasets: 1; Downregulated datasets: 3.
Survival by AP1M2 expression:
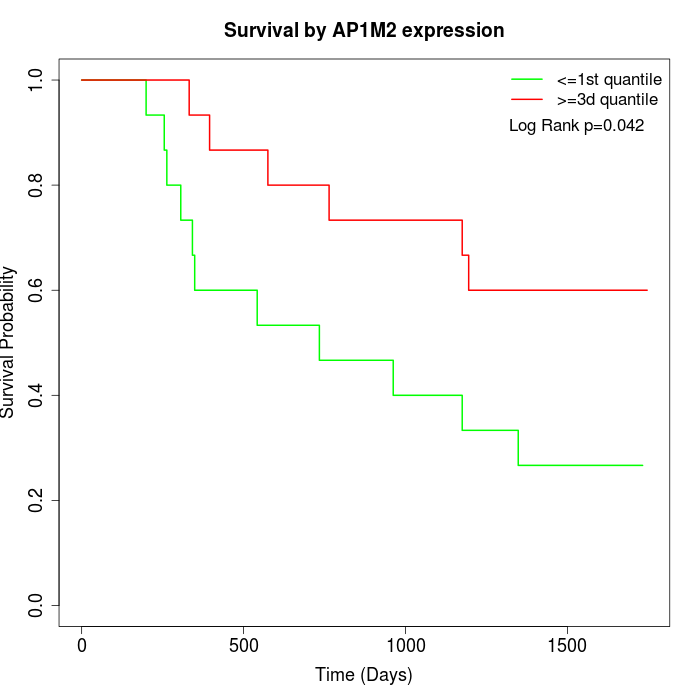 | 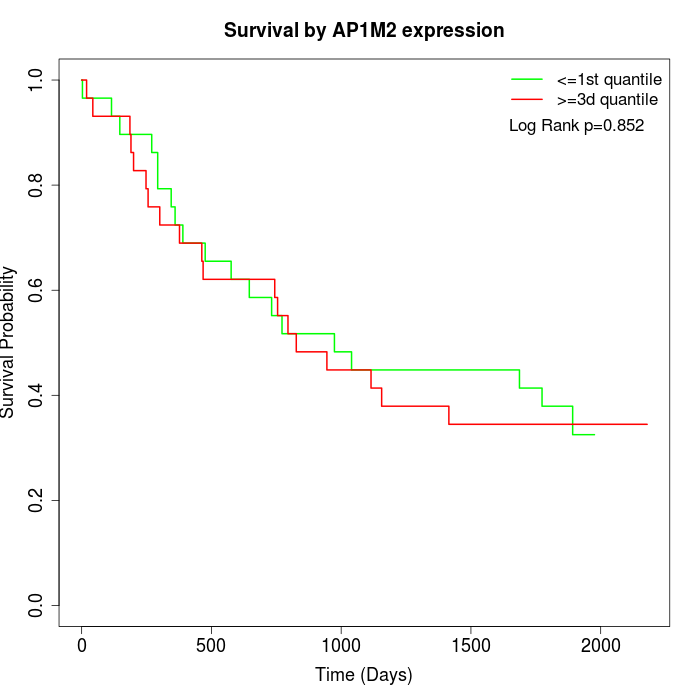 | 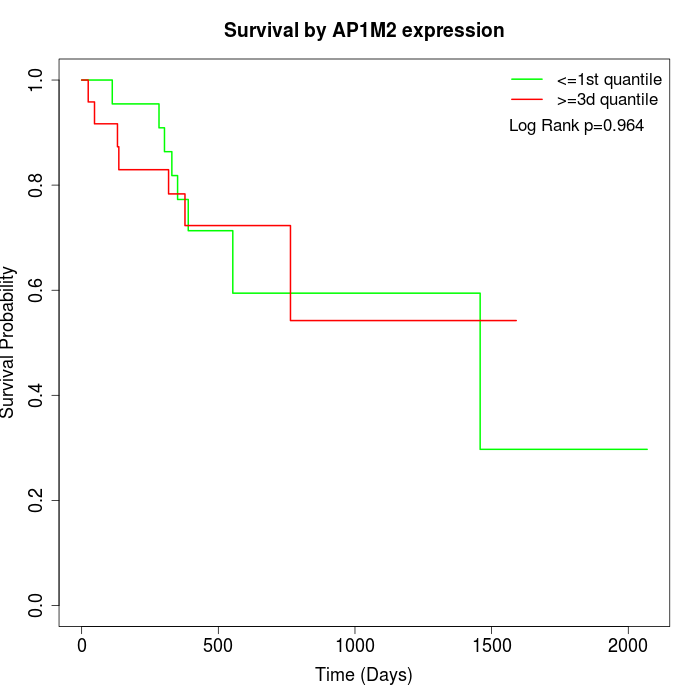 |
| GSE53622 | GSE53624 | TCGA |
Note: Click image to view full size file.
Copy number change of AP1M2:
| Dataset | Gene | EntrezID | Gain | Loss | Normal | Detail |
|---|---|---|---|---|---|---|
| GSE15526 | AP1M2 | 10053 | 4 | 3 | 23 | |
| GSE20123 | AP1M2 | 10053 | 3 | 1 | 26 | |
| GSE43470 | AP1M2 | 10053 | 3 | 6 | 34 | |
| GSE46452 | AP1M2 | 10053 | 47 | 1 | 11 | |
| GSE47630 | AP1M2 | 10053 | 4 | 7 | 29 | |
| GSE54993 | AP1M2 | 10053 | 16 | 3 | 51 | |
| GSE54994 | AP1M2 | 10053 | 6 | 13 | 34 | |
| GSE60625 | AP1M2 | 10053 | 9 | 0 | 2 | |
| GSE74703 | AP1M2 | 10053 | 3 | 4 | 29 | |
| GSE74704 | AP1M2 | 10053 | 0 | 1 | 19 | |
| TCGA | AP1M2 | 10053 | 15 | 14 | 67 |
Total number of gains: 110; Total number of losses: 53; Total Number of normals: 325.
Somatic mutations of AP1M2:
Generating mutation plots.
Highly correlated genes for AP1M2:
Showing top 20/959 corelated genes with mean PCC>0.5.
| Gene1 | Gene2 | Mean PCC | Num. Datasets | Num. PCC<0 | Num. PCC>0.5 |
|---|---|---|---|---|---|
| AP1M2 | SNX12 | 0.81824 | 3 | 0 | 3 |
| AP1M2 | ZNF416 | 0.808922 | 3 | 0 | 3 |
| AP1M2 | POLE3 | 0.801593 | 4 | 0 | 4 |
| AP1M2 | IRX3 | 0.78604 | 3 | 0 | 3 |
| AP1M2 | SAMD12 | 0.773947 | 3 | 0 | 3 |
| AP1M2 | GNL3 | 0.759337 | 3 | 0 | 3 |
| AP1M2 | SORD | 0.743374 | 4 | 0 | 4 |
| AP1M2 | COG3 | 0.736068 | 3 | 0 | 3 |
| AP1M2 | CNKSR1 | 0.73012 | 7 | 0 | 7 |
| AP1M2 | MEN1 | 0.729547 | 3 | 0 | 3 |
| AP1M2 | SLC30A6 | 0.72186 | 3 | 0 | 3 |
| AP1M2 | TYSND1 | 0.71885 | 5 | 0 | 5 |
| AP1M2 | UNC13D | 0.717489 | 3 | 0 | 3 |
| AP1M2 | TNKS2 | 0.71476 | 5 | 0 | 5 |
| AP1M2 | SLC25A39 | 0.711065 | 8 | 0 | 7 |
| AP1M2 | RHNO1 | 0.706004 | 3 | 0 | 3 |
| AP1M2 | EEFSEC | 0.705996 | 4 | 0 | 4 |
| AP1M2 | CHD7 | 0.705548 | 4 | 0 | 3 |
| AP1M2 | E2F8 | 0.704039 | 7 | 0 | 6 |
| AP1M2 | PTGES2 | 0.703903 | 5 | 0 | 4 |
For details and further investigation, click here