| Full name: connector enhancer of kinase suppressor of Ras 1 | Alias Symbol: CNK1|KSR|CNK | ||
| Type: protein-coding gene | Cytoband: 1p36.11 | ||
| Entrez ID: 10256 | HGNC ID: HGNC:19700 | Ensembl Gene: ENSG00000142675 | OMIM ID: 603272 |
Expression of CNKSR1:
| Dataset | Gene | EntrezID | Probe | Log2FC | Adj.pValue | Expression |
|---|---|---|---|---|---|---|
| GSE17351 | CNKSR1 | 10256 | 204740_at | -0.0057 | 0.9956 | |
| GSE20347 | CNKSR1 | 10256 | 204740_at | -0.4563 | 0.0012 | |
| GSE23400 | CNKSR1 | 10256 | 204740_at | -0.2827 | 0.0015 | |
| GSE26886 | CNKSR1 | 10256 | 204740_at | -0.0025 | 0.9901 | |
| GSE29001 | CNKSR1 | 10256 | 204740_at | -0.3950 | 0.0706 | |
| GSE38129 | CNKSR1 | 10256 | 204740_at | -0.1413 | 0.4183 | |
| GSE45670 | CNKSR1 | 10256 | 204740_at | 0.0240 | 0.9097 | |
| GSE53622 | CNKSR1 | 10256 | 89727 | -0.3147 | 0.1774 | |
| GSE53624 | CNKSR1 | 10256 | 9781 | -0.6864 | 0.0000 | |
| GSE63941 | CNKSR1 | 10256 | 204740_at | 1.7108 | 0.0025 | |
| GSE77861 | CNKSR1 | 10256 | 204740_at | -0.3487 | 0.0244 | |
| GSE97050 | CNKSR1 | 10256 | A_33_P3386242 | 0.1388 | 0.8292 | |
| SRP007169 | CNKSR1 | 10256 | RNAseq | -1.5815 | 0.0011 | |
| SRP008496 | CNKSR1 | 10256 | RNAseq | -1.6924 | 0.0000 | |
| SRP064894 | CNKSR1 | 10256 | RNAseq | -0.9425 | 0.0129 | |
| SRP133303 | CNKSR1 | 10256 | RNAseq | -0.8017 | 0.0000 | |
| SRP159526 | CNKSR1 | 10256 | RNAseq | -0.6924 | 0.0555 | |
| SRP193095 | CNKSR1 | 10256 | RNAseq | -0.4374 | 0.0113 | |
| SRP219564 | CNKSR1 | 10256 | RNAseq | -0.5979 | 0.4777 | |
| TCGA | CNKSR1 | 10256 | RNAseq | 0.2170 | 0.1035 |
Upregulated datasets: 1; Downregulated datasets: 2.
Survival by CNKSR1 expression:
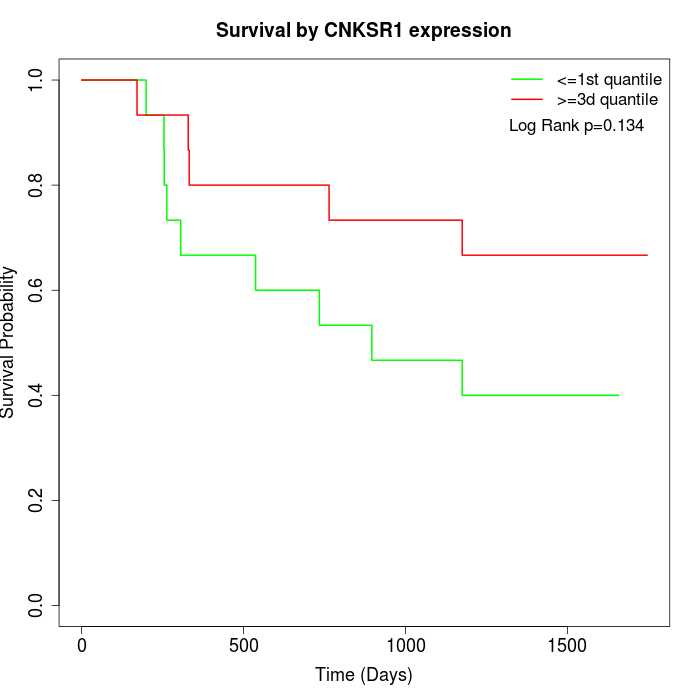 | 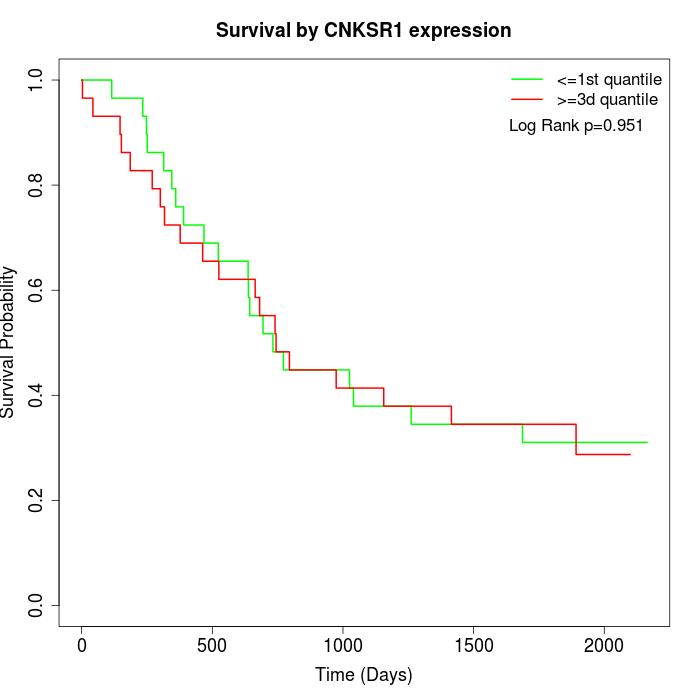 | 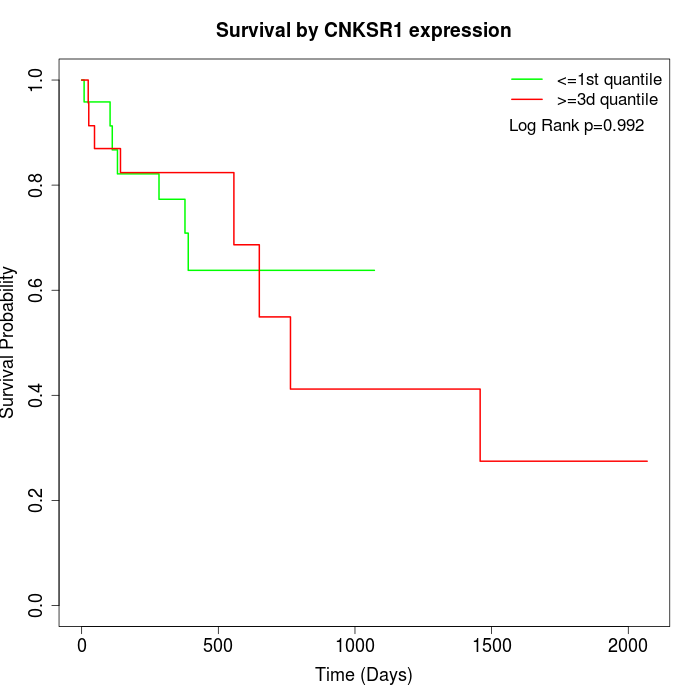 |
| GSE53622 | GSE53624 | TCGA |
Note: Click image to view full size file.
Copy number change of CNKSR1:
| Dataset | Gene | EntrezID | Gain | Loss | Normal | Detail |
|---|---|---|---|---|---|---|
| GSE15526 | CNKSR1 | 10256 | 0 | 6 | 24 | |
| GSE20123 | CNKSR1 | 10256 | 0 | 5 | 25 | |
| GSE43470 | CNKSR1 | 10256 | 2 | 6 | 35 | |
| GSE46452 | CNKSR1 | 10256 | 5 | 1 | 53 | |
| GSE47630 | CNKSR1 | 10256 | 8 | 3 | 29 | |
| GSE54993 | CNKSR1 | 10256 | 2 | 1 | 67 | |
| GSE54994 | CNKSR1 | 10256 | 10 | 4 | 39 | |
| GSE60625 | CNKSR1 | 10256 | 0 | 0 | 11 | |
| GSE74703 | CNKSR1 | 10256 | 1 | 4 | 31 | |
| GSE74704 | CNKSR1 | 10256 | 0 | 0 | 20 | |
| TCGA | CNKSR1 | 10256 | 9 | 24 | 63 |
Total number of gains: 37; Total number of losses: 54; Total Number of normals: 397.
Somatic mutations of CNKSR1:
Generating mutation plots.
Highly correlated genes for CNKSR1:
Showing top 20/916 corelated genes with mean PCC>0.5.
| Gene1 | Gene2 | Mean PCC | Num. Datasets | Num. PCC<0 | Num. PCC>0.5 |
|---|---|---|---|---|---|
| CNKSR1 | CD22 | 0.807518 | 3 | 0 | 3 |
| CNKSR1 | NIPAL1 | 0.756702 | 3 | 0 | 3 |
| CNKSR1 | SYTL1 | 0.752852 | 6 | 0 | 6 |
| CNKSR1 | NUAK2 | 0.743591 | 3 | 0 | 3 |
| CNKSR1 | AP1M2 | 0.73012 | 7 | 0 | 7 |
| CNKSR1 | FAM83G | 0.728981 | 4 | 0 | 4 |
| CNKSR1 | PHYHD1 | 0.728691 | 3 | 0 | 3 |
| CNKSR1 | PLEKHH1 | 0.72673 | 3 | 0 | 3 |
| CNKSR1 | PPP1R13L | 0.723717 | 12 | 0 | 12 |
| CNKSR1 | MARVELD2 | 0.723638 | 5 | 0 | 4 |
| CNKSR1 | AP1S3 | 0.719172 | 5 | 0 | 4 |
| CNKSR1 | DDI2 | 0.713819 | 3 | 0 | 3 |
| CNKSR1 | OSBPL7 | 0.713111 | 3 | 0 | 3 |
| CNKSR1 | CPTP | 0.711615 | 9 | 0 | 9 |
| CNKSR1 | GALE | 0.711272 | 10 | 0 | 10 |
| CNKSR1 | SLAMF7 | 0.710407 | 3 | 0 | 3 |
| CNKSR1 | C19orf33 | 0.705649 | 7 | 0 | 7 |
| CNKSR1 | RIT2 | 0.702031 | 3 | 0 | 3 |
| CNKSR1 | MVB12A | 0.700347 | 3 | 0 | 3 |
| CNKSR1 | C9orf116 | 0.697462 | 3 | 0 | 3 |
For details and further investigation, click here