| Full name: apolipoprotein A2 | Alias Symbol: | ||
| Type: protein-coding gene | Cytoband: 1q23.3 | ||
| Entrez ID: 336 | HGNC ID: HGNC:601 | Ensembl Gene: ENSG00000158874 | OMIM ID: 107670 |
| Related drugs: ETRETINATE... [more] | |||
APOA2 involved pathways:
| KEGG pathway | Description | View |
|---|---|---|
| hsa03320 | PPAR signaling pathway |
Expression of APOA2:
| Dataset | Gene | EntrezID | Probe | Log2FC | Adj.pValue | Expression |
|---|---|---|---|---|---|---|
| GSE17351 | APOA2 | 336 | 219465_at | -0.0792 | 0.7806 | |
| GSE20347 | APOA2 | 336 | 219466_s_at | 0.0184 | 0.8057 | |
| GSE23400 | APOA2 | 336 | 219465_at | -0.1265 | 0.0000 | |
| GSE26886 | APOA2 | 336 | 219465_at | -0.0384 | 0.7562 | |
| GSE29001 | APOA2 | 336 | 219465_at | -0.2793 | 0.0102 | |
| GSE38129 | APOA2 | 336 | 219466_s_at | -0.0838 | 0.2129 | |
| GSE45670 | APOA2 | 336 | 219466_s_at | 0.0338 | 0.7534 | |
| GSE53622 | APOA2 | 336 | 77915 | 0.1931 | 0.0071 | |
| GSE53624 | APOA2 | 336 | 77915 | 0.2454 | 0.0138 | |
| GSE63941 | APOA2 | 336 | 219465_at | 0.1278 | 0.4753 | |
| GSE77861 | APOA2 | 336 | 219465_at | -0.2156 | 0.0345 | |
| GSE97050 | APOA2 | 336 | A_24_P302249 | -0.0132 | 0.9653 | |
| TCGA | APOA2 | 336 | RNAseq | 1.7990 | 0.3469 |
Upregulated datasets: 0; Downregulated datasets: 0.
Survival by APOA2 expression:
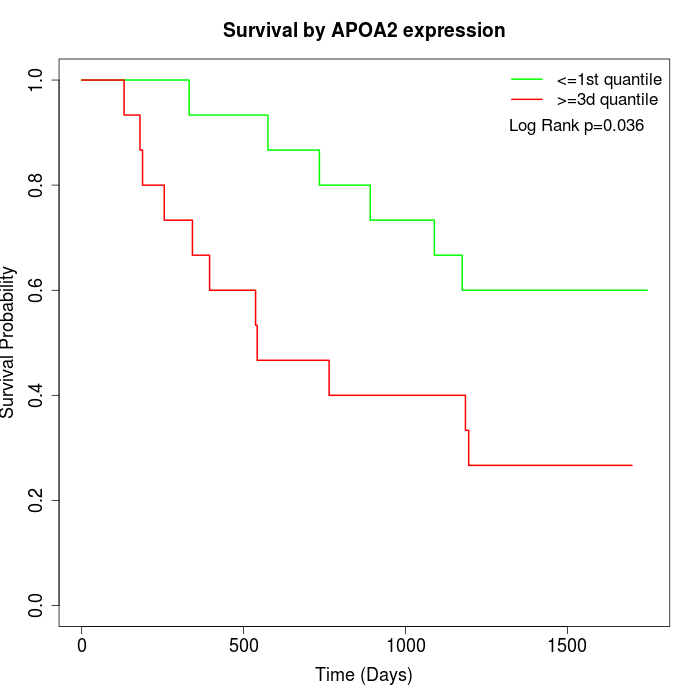 | 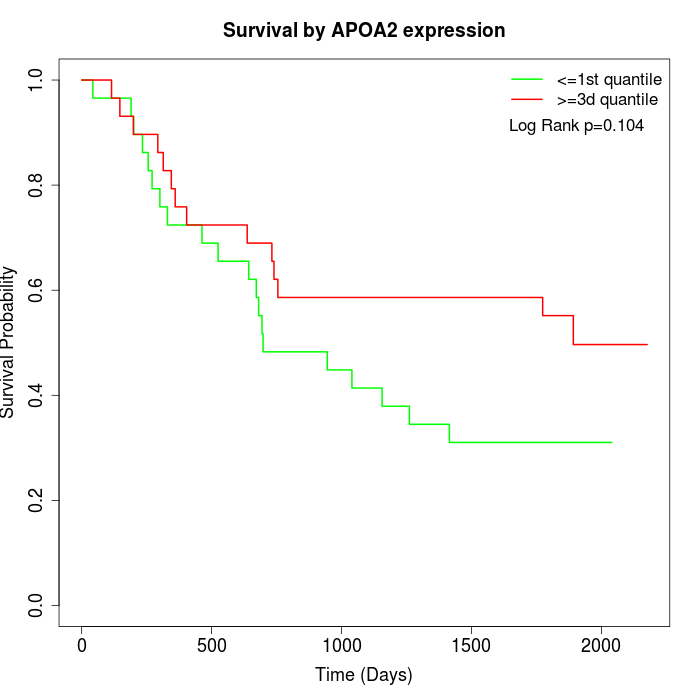 | 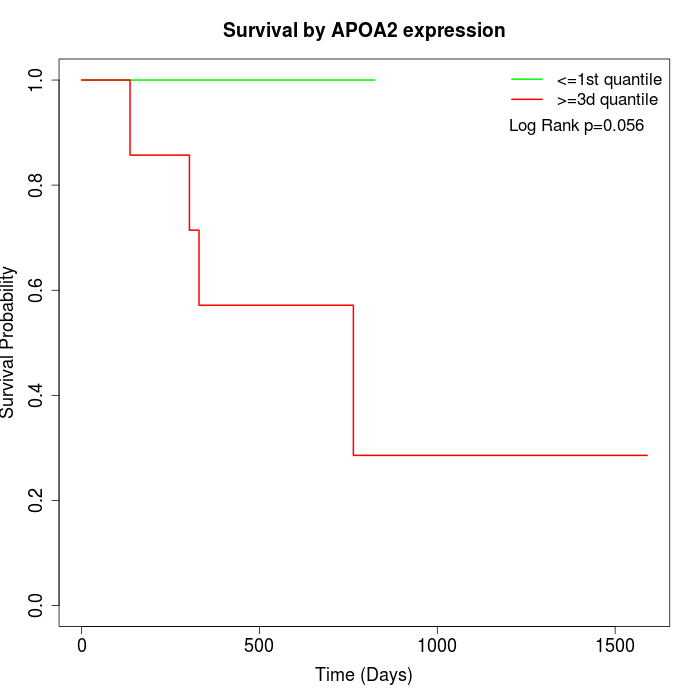 |
| GSE53622 | GSE53624 | TCGA |
Note: Click image to view full size file.
Copy number change of APOA2:
| Dataset | Gene | EntrezID | Gain | Loss | Normal | Detail |
|---|---|---|---|---|---|---|
| GSE15526 | APOA2 | 336 | 10 | 0 | 20 | |
| GSE20123 | APOA2 | 336 | 10 | 0 | 20 | |
| GSE43470 | APOA2 | 336 | 7 | 2 | 34 | |
| GSE46452 | APOA2 | 336 | 2 | 1 | 56 | |
| GSE47630 | APOA2 | 336 | 14 | 0 | 26 | |
| GSE54993 | APOA2 | 336 | 0 | 6 | 64 | |
| GSE54994 | APOA2 | 336 | 16 | 0 | 37 | |
| GSE60625 | APOA2 | 336 | 0 | 0 | 11 | |
| GSE74703 | APOA2 | 336 | 7 | 2 | 27 | |
| GSE74704 | APOA2 | 336 | 4 | 0 | 16 | |
| TCGA | APOA2 | 336 | 45 | 3 | 48 |
Total number of gains: 115; Total number of losses: 14; Total Number of normals: 359.
Somatic mutations of APOA2:
Generating mutation plots.
Highly correlated genes for APOA2:
Showing top 20/504 corelated genes with mean PCC>0.5.
| Gene1 | Gene2 | Mean PCC | Num. Datasets | Num. PCC<0 | Num. PCC>0.5 |
|---|---|---|---|---|---|
| APOA2 | CSTF2 | 0.730617 | 3 | 0 | 3 |
| APOA2 | SPRYD4 | 0.711173 | 3 | 0 | 3 |
| APOA2 | LINC00424 | 0.695566 | 3 | 0 | 3 |
| APOA2 | CITED2 | 0.691117 | 3 | 0 | 3 |
| APOA2 | PGM2 | 0.687723 | 3 | 0 | 3 |
| APOA2 | GYPC | 0.67917 | 3 | 0 | 3 |
| APOA2 | HSH2D | 0.678853 | 3 | 0 | 3 |
| APOA2 | KRTAP10-9 | 0.674356 | 3 | 0 | 3 |
| APOA2 | CGNL1 | 0.664098 | 3 | 0 | 3 |
| APOA2 | VPS53 | 0.657554 | 3 | 0 | 3 |
| APOA2 | FAM222A-AS1 | 0.656316 | 3 | 0 | 3 |
| APOA2 | KCNG2 | 0.649965 | 6 | 0 | 6 |
| APOA2 | SFTA2 | 0.648298 | 3 | 0 | 3 |
| APOA2 | CCIN | 0.644913 | 7 | 0 | 7 |
| APOA2 | DUSP13 | 0.644834 | 5 | 0 | 5 |
| APOA2 | TSPO | 0.643662 | 5 | 0 | 4 |
| APOA2 | SPTLC2 | 0.642512 | 3 | 0 | 3 |
| APOA2 | C3orf80 | 0.64181 | 3 | 0 | 3 |
| APOA2 | HSPB6 | 0.6417 | 3 | 0 | 3 |
| APOA2 | PINK1 | 0.640577 | 4 | 0 | 3 |
For details and further investigation, click here