| Full name: atlastin GTPase 2 | Alias Symbol: | ||
| Type: protein-coding gene | Cytoband: 2p22.2-p22.1 | ||
| Entrez ID: 64225 | HGNC ID: HGNC:24047 | Ensembl Gene: ENSG00000119787 | OMIM ID: 609368 |
Screen Evidence:
| |||
Expression of ATL2:
| Dataset | Gene | EntrezID | Probe | Log2FC | Adj.pValue | Expression |
|---|---|---|---|---|---|---|
| GSE17351 | ATL2 | 64225 | 222700_at | -0.1788 | 0.5118 | |
| GSE26886 | ATL2 | 64225 | 222700_at | -0.5572 | 0.0467 | |
| GSE45670 | ATL2 | 64225 | 222700_at | 0.1172 | 0.5749 | |
| GSE53622 | ATL2 | 64225 | 71666 | -0.0472 | 0.5700 | |
| GSE53624 | ATL2 | 64225 | 71666 | -0.0316 | 0.6075 | |
| GSE63941 | ATL2 | 64225 | 222700_at | 1.2252 | 0.0049 | |
| GSE77861 | ATL2 | 64225 | 222700_at | 0.3686 | 0.1028 | |
| GSE97050 | ATL2 | 64225 | A_23_P209619 | -0.4335 | 0.2213 | |
| SRP007169 | ATL2 | 64225 | RNAseq | -0.3716 | 0.3343 | |
| SRP008496 | ATL2 | 64225 | RNAseq | -0.1091 | 0.6581 | |
| SRP064894 | ATL2 | 64225 | RNAseq | -0.4469 | 0.0133 | |
| SRP133303 | ATL2 | 64225 | RNAseq | 0.0935 | 0.5994 | |
| SRP159526 | ATL2 | 64225 | RNAseq | 0.4021 | 0.2239 | |
| SRP193095 | ATL2 | 64225 | RNAseq | -0.0942 | 0.5476 | |
| SRP219564 | ATL2 | 64225 | RNAseq | -0.2472 | 0.4240 | |
| TCGA | ATL2 | 64225 | RNAseq | 0.0947 | 0.0491 |
Upregulated datasets: 1; Downregulated datasets: 0.
Survival by ATL2 expression:
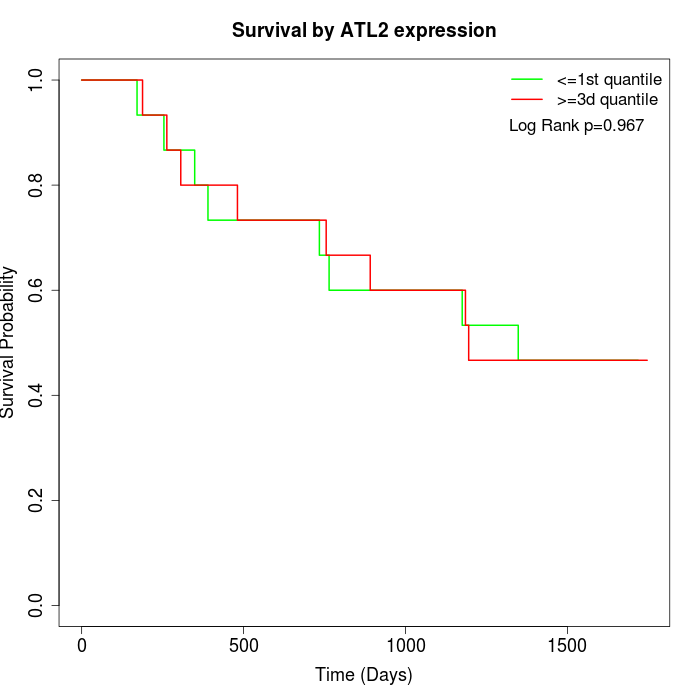 | 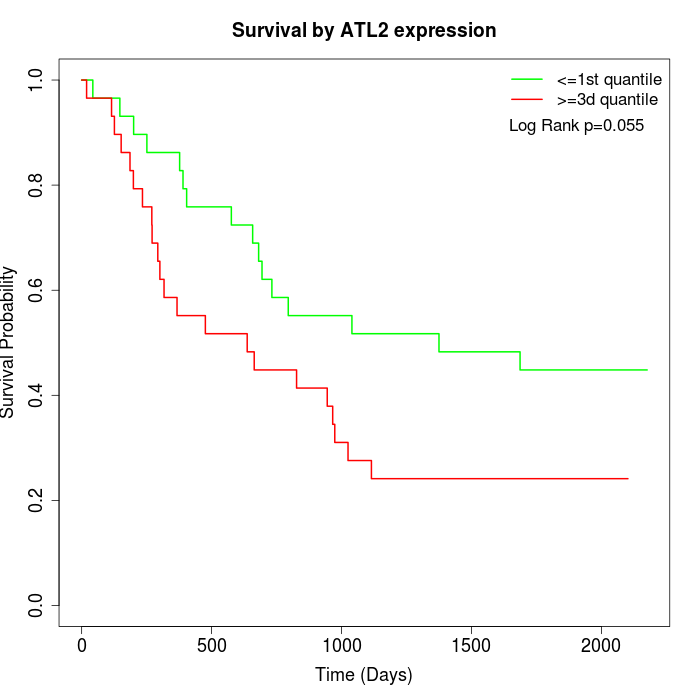 | 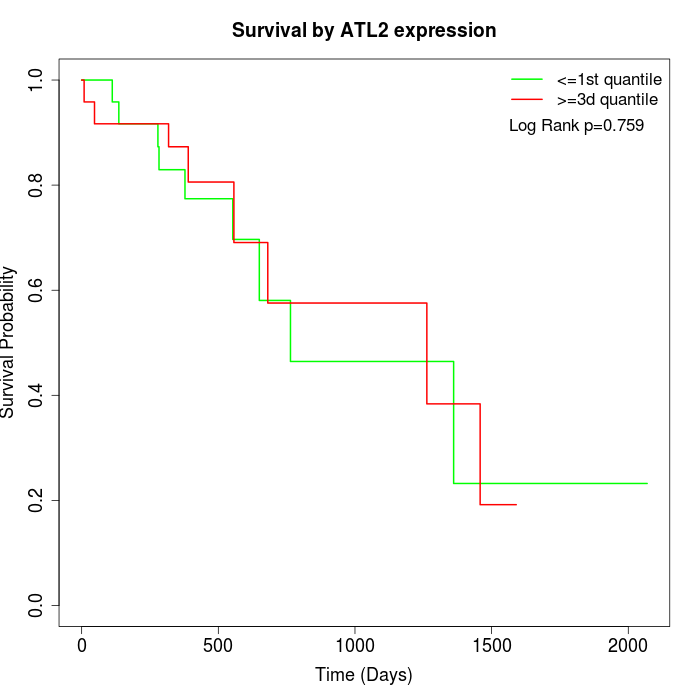 |
| GSE53622 | GSE53624 | TCGA |
Note: Click image to view full size file.
Copy number change of ATL2:
| Dataset | Gene | EntrezID | Gain | Loss | Normal | Detail |
|---|---|---|---|---|---|---|
| GSE15526 | ATL2 | 64225 | 11 | 1 | 18 | |
| GSE20123 | ATL2 | 64225 | 10 | 1 | 19 | |
| GSE43470 | ATL2 | 64225 | 3 | 0 | 40 | |
| GSE46452 | ATL2 | 64225 | 1 | 4 | 54 | |
| GSE47630 | ATL2 | 64225 | 7 | 0 | 33 | |
| GSE54993 | ATL2 | 64225 | 0 | 5 | 65 | |
| GSE54994 | ATL2 | 64225 | 10 | 0 | 43 | |
| GSE60625 | ATL2 | 64225 | 0 | 3 | 8 | |
| GSE74703 | ATL2 | 64225 | 3 | 0 | 33 | |
| GSE74704 | ATL2 | 64225 | 9 | 1 | 10 | |
| TCGA | ATL2 | 64225 | 35 | 2 | 59 |
Total number of gains: 89; Total number of losses: 17; Total Number of normals: 382.
Somatic mutations of ATL2:
Generating mutation plots.
Highly correlated genes for ATL2:
Showing top 20/217 corelated genes with mean PCC>0.5.
| Gene1 | Gene2 | Mean PCC | Num. Datasets | Num. PCC<0 | Num. PCC>0.5 |
|---|---|---|---|---|---|
| ATL2 | SPAST | 0.764053 | 3 | 0 | 3 |
| ATL2 | ELOVL7 | 0.739676 | 3 | 0 | 3 |
| ATL2 | COCH | 0.72948 | 3 | 0 | 3 |
| ATL2 | PRPF38A | 0.727472 | 3 | 0 | 3 |
| ATL2 | TMEM135 | 0.704027 | 3 | 0 | 3 |
| ATL2 | YTHDC2 | 0.697542 | 3 | 0 | 3 |
| ATL2 | MORC4 | 0.697085 | 3 | 0 | 3 |
| ATL2 | MID1IP1 | 0.694847 | 3 | 0 | 3 |
| ATL2 | NIT1 | 0.69431 | 3 | 0 | 3 |
| ATL2 | PPTC7 | 0.693458 | 3 | 0 | 3 |
| ATL2 | RNF181 | 0.690924 | 3 | 0 | 3 |
| ATL2 | DLD | 0.689437 | 3 | 0 | 3 |
| ATL2 | PDHX | 0.686776 | 3 | 0 | 3 |
| ATL2 | SF3A1 | 0.685603 | 3 | 0 | 3 |
| ATL2 | NEMF | 0.685595 | 3 | 0 | 3 |
| ATL2 | MRPS27 | 0.685234 | 3 | 0 | 3 |
| ATL2 | RPF1 | 0.68038 | 3 | 0 | 3 |
| ATL2 | CNOT1 | 0.678114 | 3 | 0 | 3 |
| ATL2 | HSPA2 | 0.676511 | 3 | 0 | 3 |
| ATL2 | PTCD2 | 0.675286 | 3 | 0 | 3 |
For details and further investigation, click here