| Full name: atlastin GTPase 3 | Alias Symbol: DKFZP564J0863 | ||
| Type: protein-coding gene | Cytoband: 11q13.1 | ||
| Entrez ID: 25923 | HGNC ID: HGNC:24526 | Ensembl Gene: ENSG00000184743 | OMIM ID: 609369 |
Expression of ATL3:
| Dataset | Gene | EntrezID | Probe | Log2FC | Adj.pValue | Expression |
|---|---|---|---|---|---|---|
| GSE17351 | ATL3 | 25923 | 224893_at | -0.2276 | 0.7443 | |
| GSE26886 | ATL3 | 25923 | 224893_at | -0.2133 | 0.5363 | |
| GSE45670 | ATL3 | 25923 | 224893_at | -0.5205 | 0.0014 | |
| GSE53622 | ATL3 | 25923 | 127651 | -0.2749 | 0.0013 | |
| GSE53624 | ATL3 | 25923 | 127651 | 0.1194 | 0.0924 | |
| GSE63941 | ATL3 | 25923 | 224893_at | -1.6513 | 0.0096 | |
| GSE77861 | ATL3 | 25923 | 224893_at | -0.3961 | 0.2921 | |
| GSE97050 | ATL3 | 25923 | A_23_P105028 | -0.2248 | 0.3221 | |
| SRP007169 | ATL3 | 25923 | RNAseq | -0.5581 | 0.0868 | |
| SRP008496 | ATL3 | 25923 | RNAseq | -0.1952 | 0.3291 | |
| SRP064894 | ATL3 | 25923 | RNAseq | -0.0782 | 0.5890 | |
| SRP133303 | ATL3 | 25923 | RNAseq | -0.0273 | 0.8932 | |
| SRP159526 | ATL3 | 25923 | RNAseq | -0.5570 | 0.0968 | |
| SRP193095 | ATL3 | 25923 | RNAseq | -0.2945 | 0.0186 | |
| SRP219564 | ATL3 | 25923 | RNAseq | -0.4067 | 0.2934 | |
| TCGA | ATL3 | 25923 | RNAseq | -0.0446 | 0.5521 |
Upregulated datasets: 0; Downregulated datasets: 1.
Survival by ATL3 expression:
 | 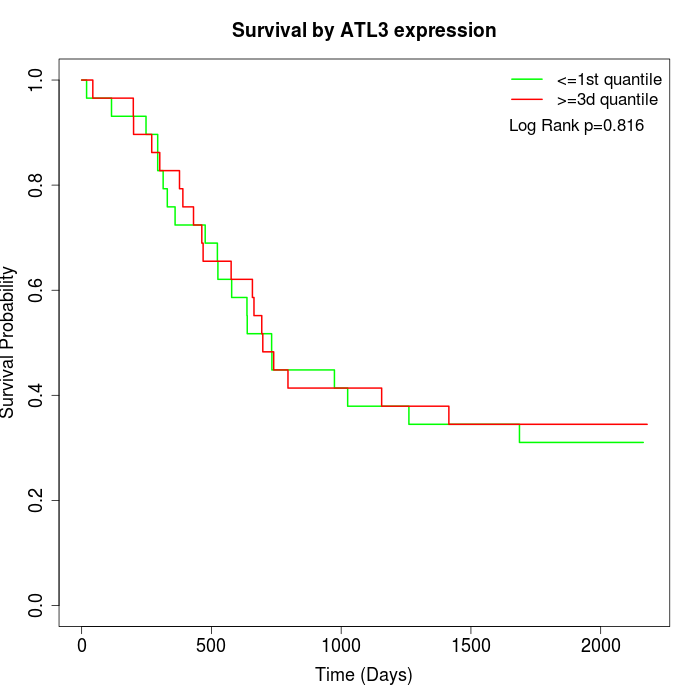 | 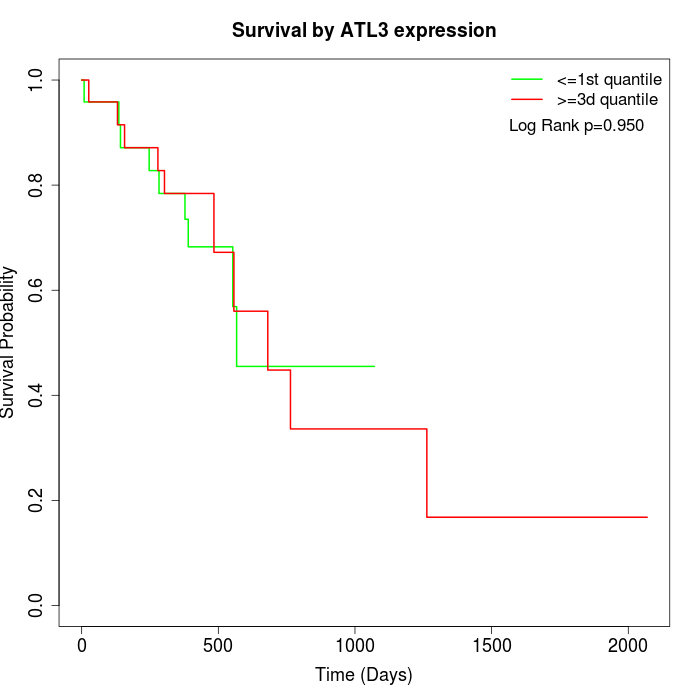 |
| GSE53622 | GSE53624 | TCGA |
Note: Click image to view full size file.
Copy number change of ATL3:
| Dataset | Gene | EntrezID | Gain | Loss | Normal | Detail |
|---|---|---|---|---|---|---|
| GSE15526 | ATL3 | 25923 | 6 | 5 | 19 | |
| GSE20123 | ATL3 | 25923 | 6 | 5 | 19 | |
| GSE43470 | ATL3 | 25923 | 1 | 4 | 38 | |
| GSE46452 | ATL3 | 25923 | 8 | 4 | 47 | |
| GSE47630 | ATL3 | 25923 | 3 | 7 | 30 | |
| GSE54993 | ATL3 | 25923 | 3 | 0 | 67 | |
| GSE54994 | ATL3 | 25923 | 5 | 5 | 43 | |
| GSE60625 | ATL3 | 25923 | 0 | 4 | 7 | |
| GSE74703 | ATL3 | 25923 | 1 | 2 | 33 | |
| GSE74704 | ATL3 | 25923 | 4 | 3 | 13 | |
| TCGA | ATL3 | 25923 | 16 | 11 | 69 |
Total number of gains: 53; Total number of losses: 50; Total Number of normals: 385.
Somatic mutations of ATL3:
Generating mutation plots.
Highly correlated genes for ATL3:
Showing top 20/194 corelated genes with mean PCC>0.5.
| Gene1 | Gene2 | Mean PCC | Num. Datasets | Num. PCC<0 | Num. PCC>0.5 |
|---|---|---|---|---|---|
| ATL3 | PTGIS | 0.656357 | 3 | 0 | 3 |
| ATL3 | OLFML3 | 0.652978 | 3 | 0 | 3 |
| ATL3 | SYNC | 0.641019 | 5 | 0 | 5 |
| ATL3 | COPZ2 | 0.636807 | 3 | 0 | 3 |
| ATL3 | CEP112 | 0.63618 | 4 | 0 | 3 |
| ATL3 | CNN1 | 0.635853 | 3 | 0 | 3 |
| ATL3 | RSU1 | 0.633915 | 4 | 0 | 4 |
| ATL3 | ASB1 | 0.632199 | 3 | 0 | 3 |
| ATL3 | PTPN21 | 0.630881 | 7 | 0 | 6 |
| ATL3 | DOK6 | 0.630653 | 3 | 0 | 3 |
| ATL3 | SMTN | 0.629407 | 3 | 0 | 3 |
| ATL3 | FGL2 | 0.624217 | 3 | 0 | 3 |
| ATL3 | ACTG2 | 0.624111 | 4 | 0 | 3 |
| ATL3 | ADD1 | 0.621702 | 6 | 0 | 6 |
| ATL3 | SFRP1 | 0.615637 | 3 | 0 | 3 |
| ATL3 | NIPSNAP3A | 0.613268 | 4 | 0 | 3 |
| ATL3 | DENND2A | 0.611148 | 4 | 0 | 3 |
| ATL3 | LTBP1 | 0.610974 | 3 | 0 | 3 |
| ATL3 | FLNA | 0.607601 | 3 | 0 | 3 |
| ATL3 | LMOD1 | 0.607519 | 4 | 0 | 3 |
For details and further investigation, click here