| Full name: B cell scaffold protein with ankyrin repeats 1 | Alias Symbol: BANK|FLJ20706 | ||
| Type: protein-coding gene | Cytoband: 4q24 | ||
| Entrez ID: 55024 | HGNC ID: HGNC:18233 | Ensembl Gene: ENSG00000153064 | OMIM ID: 610292 |
Expression of BANK1:
| Dataset | Gene | EntrezID | Probe | Log2FC | Adj.pValue | Expression |
|---|---|---|---|---|---|---|
| GSE17351 | BANK1 | 55024 | 1558662_s_at | -0.2922 | 0.8468 | |
| GSE20347 | BANK1 | 55024 | 219667_s_at | 0.0134 | 0.9530 | |
| GSE23400 | BANK1 | 55024 | 219667_s_at | 0.0118 | 0.8077 | |
| GSE26886 | BANK1 | 55024 | 222915_s_at | -0.0623 | 0.5277 | |
| GSE29001 | BANK1 | 55024 | 219667_s_at | 0.4446 | 0.2066 | |
| GSE38129 | BANK1 | 55024 | 219667_s_at | -0.2902 | 0.3425 | |
| GSE45670 | BANK1 | 55024 | 219667_s_at | -0.1852 | 0.7804 | |
| GSE53622 | BANK1 | 55024 | 115021 | -1.1585 | 0.0000 | |
| GSE53624 | BANK1 | 55024 | 115021 | -1.4240 | 0.0000 | |
| GSE63941 | BANK1 | 55024 | 1558662_s_at | -0.4995 | 0.1941 | |
| GSE77861 | BANK1 | 55024 | 222915_s_at | -0.1049 | 0.2558 | |
| GSE97050 | BANK1 | 55024 | A_23_P10232 | 0.5787 | 0.3138 | |
| SRP133303 | BANK1 | 55024 | RNAseq | -0.8899 | 0.0575 | |
| SRP159526 | BANK1 | 55024 | RNAseq | -1.8313 | 0.0333 | |
| SRP193095 | BANK1 | 55024 | RNAseq | 0.0140 | 0.9732 | |
| SRP219564 | BANK1 | 55024 | RNAseq | -0.0077 | 0.9936 | |
| TCGA | BANK1 | 55024 | RNAseq | -0.3228 | 0.2799 |
Upregulated datasets: 0; Downregulated datasets: 3.
Survival by BANK1 expression:
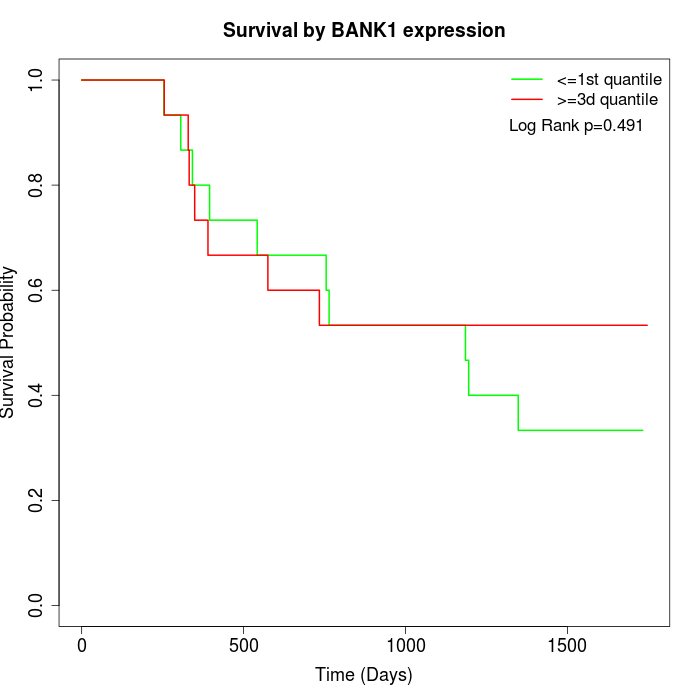 | 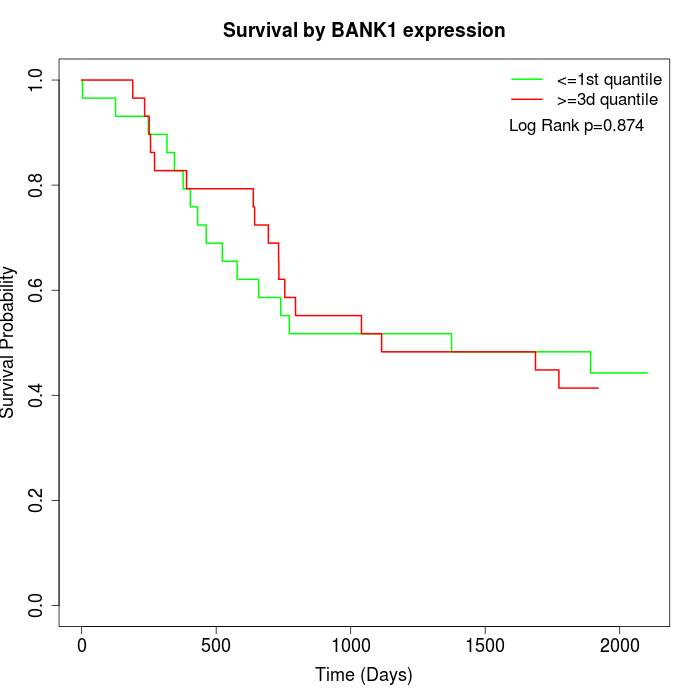 | 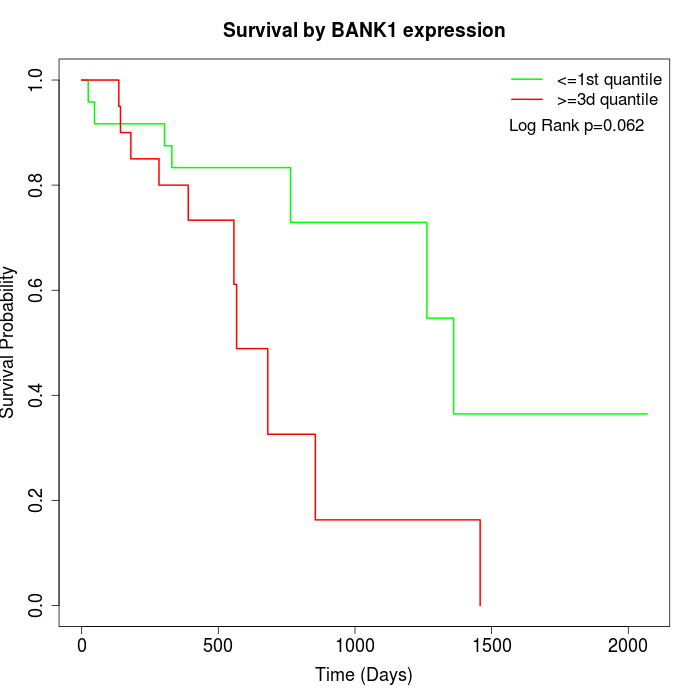 |
| GSE53622 | GSE53624 | TCGA |
Note: Click image to view full size file.
Copy number change of BANK1:
| Dataset | Gene | EntrezID | Gain | Loss | Normal | Detail |
|---|---|---|---|---|---|---|
| GSE15526 | BANK1 | 55024 | 1 | 12 | 17 | |
| GSE20123 | BANK1 | 55024 | 1 | 12 | 17 | |
| GSE43470 | BANK1 | 55024 | 0 | 13 | 30 | |
| GSE46452 | BANK1 | 55024 | 1 | 36 | 22 | |
| GSE47630 | BANK1 | 55024 | 0 | 20 | 20 | |
| GSE54993 | BANK1 | 55024 | 9 | 0 | 61 | |
| GSE54994 | BANK1 | 55024 | 1 | 11 | 41 | |
| GSE60625 | BANK1 | 55024 | 0 | 3 | 8 | |
| GSE74703 | BANK1 | 55024 | 0 | 11 | 25 | |
| GSE74704 | BANK1 | 55024 | 0 | 6 | 14 | |
| TCGA | BANK1 | 55024 | 8 | 40 | 48 |
Total number of gains: 21; Total number of losses: 164; Total Number of normals: 303.
Somatic mutations of BANK1:
Generating mutation plots.
Highly correlated genes for BANK1:
Showing top 20/185 corelated genes with mean PCC>0.5.
| Gene1 | Gene2 | Mean PCC | Num. Datasets | Num. PCC<0 | Num. PCC>0.5 |
|---|---|---|---|---|---|
| BANK1 | MS4A1 | 0.789627 | 9 | 0 | 8 |
| BANK1 | TLR10 | 0.77606 | 5 | 0 | 5 |
| BANK1 | CD37 | 0.750207 | 9 | 0 | 9 |
| BANK1 | BTLA | 0.745457 | 5 | 0 | 5 |
| BANK1 | FCRL3 | 0.74535 | 7 | 0 | 7 |
| BANK1 | GIMAP1 | 0.731187 | 3 | 0 | 3 |
| BANK1 | LINC01215 | 0.726035 | 5 | 0 | 4 |
| BANK1 | CD19 | 0.722237 | 9 | 0 | 9 |
| BANK1 | GAPT | 0.710289 | 5 | 0 | 5 |
| BANK1 | FCAMR | 0.702071 | 3 | 0 | 3 |
| BANK1 | FCRL1 | 0.697979 | 5 | 0 | 5 |
| BANK1 | PVRIG | 0.69723 | 5 | 0 | 4 |
| BANK1 | CD79A | 0.69556 | 10 | 0 | 8 |
| BANK1 | SPIB | 0.693863 | 7 | 0 | 6 |
| BANK1 | TAGAP | 0.689174 | 3 | 0 | 3 |
| BANK1 | CD28 | 0.685119 | 3 | 0 | 3 |
| BANK1 | FCRLA | 0.684019 | 8 | 0 | 7 |
| BANK1 | GIMAP8 | 0.683776 | 3 | 0 | 3 |
| BANK1 | TCL1A | 0.679544 | 7 | 0 | 6 |
| BANK1 | CNR2 | 0.675989 | 5 | 0 | 5 |
For details and further investigation, click here