| Full name: brain abundant membrane attached signal protein 1 | Alias Symbol: NAP-22|NAP22|CAP23|CAP-23 | ||
| Type: protein-coding gene | Cytoband: 5p15.1 | ||
| Entrez ID: 10409 | HGNC ID: HGNC:957 | Ensembl Gene: ENSG00000176788 | OMIM ID: 605940 |
Expression of BASP1:
| Dataset | Gene | EntrezID | Probe | Log2FC | Adj.pValue | Expression |
|---|---|---|---|---|---|---|
| GSE17351 | BASP1 | 10409 | 202391_at | 1.4319 | 0.0920 | |
| GSE20347 | BASP1 | 10409 | 202391_at | 0.9779 | 0.0277 | |
| GSE23400 | BASP1 | 10409 | 202391_at | 1.3773 | 0.0000 | |
| GSE26886 | BASP1 | 10409 | 202391_at | 1.6371 | 0.0003 | |
| GSE29001 | BASP1 | 10409 | 202391_at | 0.6810 | 0.3436 | |
| GSE38129 | BASP1 | 10409 | 202391_at | 1.1489 | 0.0006 | |
| GSE45670 | BASP1 | 10409 | 202391_at | 1.0355 | 0.0286 | |
| GSE53622 | BASP1 | 10409 | 57084 | 1.2248 | 0.0000 | |
| GSE53624 | BASP1 | 10409 | 57084 | 1.1497 | 0.0000 | |
| GSE63941 | BASP1 | 10409 | 202391_at | -1.2233 | 0.2499 | |
| GSE77861 | BASP1 | 10409 | 202391_at | 1.1872 | 0.0746 | |
| GSE97050 | BASP1 | 10409 | A_23_P213385 | 1.2543 | 0.1372 | |
| SRP007169 | BASP1 | 10409 | RNAseq | 0.9039 | 0.2065 | |
| SRP008496 | BASP1 | 10409 | RNAseq | 0.3408 | 0.5171 | |
| SRP064894 | BASP1 | 10409 | RNAseq | 1.2813 | 0.0000 | |
| SRP133303 | BASP1 | 10409 | RNAseq | 1.3933 | 0.0006 | |
| SRP193095 | BASP1 | 10409 | RNAseq | 1.2639 | 0.0000 | |
| SRP219564 | BASP1 | 10409 | RNAseq | 1.8834 | 0.0004 | |
| TCGA | BASP1 | 10409 | RNAseq | 0.5952 | 0.0000 |
Upregulated datasets: 10; Downregulated datasets: 0.
Survival by BASP1 expression:
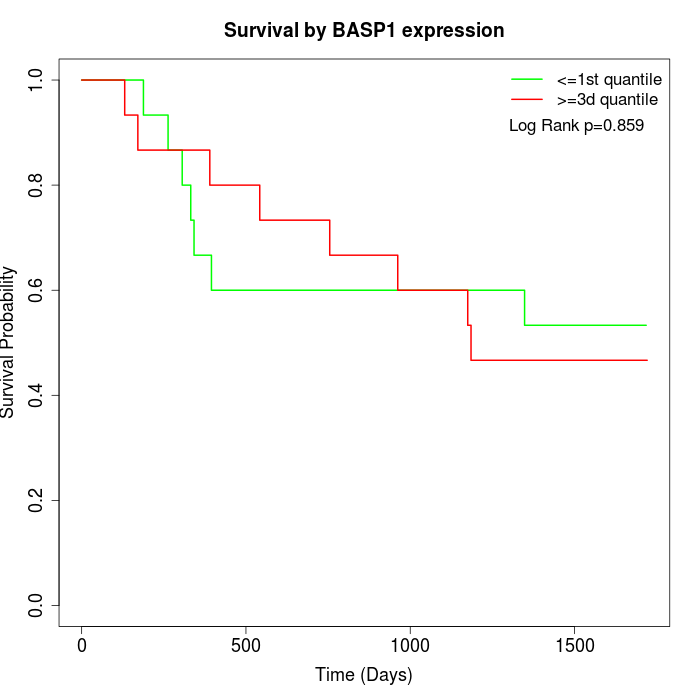 | 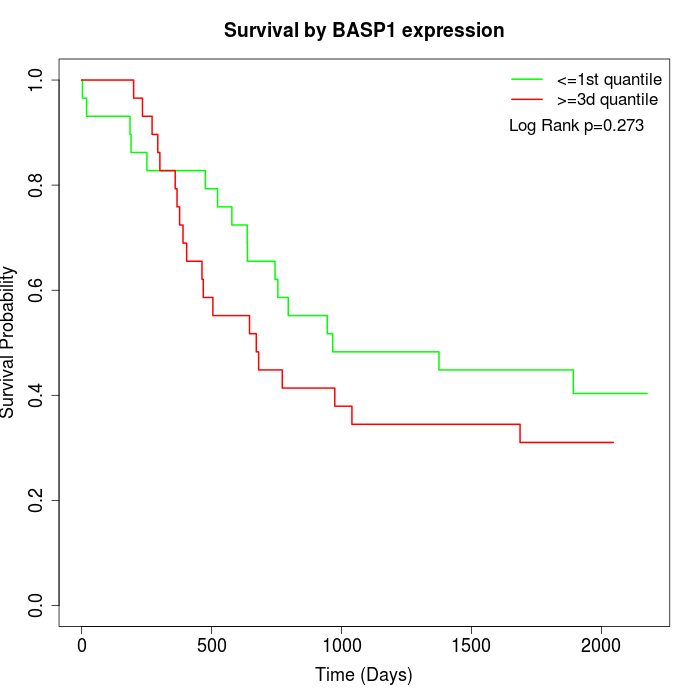 | 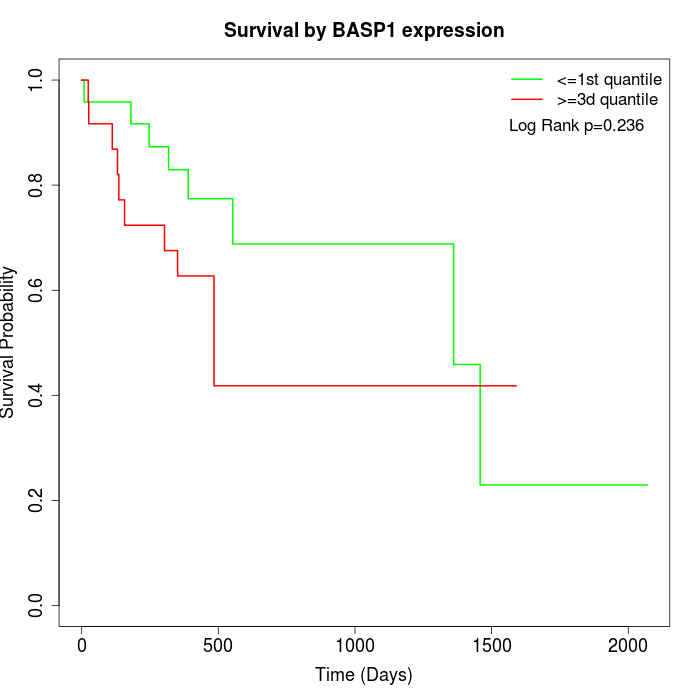 |
| GSE53622 | GSE53624 | TCGA |
Note: Click image to view full size file.
Copy number change of BASP1:
| Dataset | Gene | EntrezID | Gain | Loss | Normal | Detail |
|---|---|---|---|---|---|---|
| GSE15526 | BASP1 | 10409 | 11 | 0 | 19 | |
| GSE20123 | BASP1 | 10409 | 11 | 0 | 19 | |
| GSE43470 | BASP1 | 10409 | 18 | 0 | 25 | |
| GSE46452 | BASP1 | 10409 | 6 | 22 | 31 | |
| GSE47630 | BASP1 | 10409 | 6 | 11 | 23 | |
| GSE54993 | BASP1 | 10409 | 5 | 5 | 60 | |
| GSE54994 | BASP1 | 10409 | 29 | 2 | 22 | |
| GSE60625 | BASP1 | 10409 | 0 | 0 | 11 | |
| GSE74703 | BASP1 | 10409 | 14 | 0 | 22 | |
| GSE74704 | BASP1 | 10409 | 10 | 0 | 10 | |
| TCGA | BASP1 | 10409 | 59 | 3 | 34 |
Total number of gains: 169; Total number of losses: 43; Total Number of normals: 276.
Somatic mutations of BASP1:
Generating mutation plots.
Highly correlated genes for BASP1:
Showing top 20/1326 corelated genes with mean PCC>0.5.
| Gene1 | Gene2 | Mean PCC | Num. Datasets | Num. PCC<0 | Num. PCC>0.5 |
|---|---|---|---|---|---|
| BASP1 | ATP11C | 0.764452 | 3 | 0 | 3 |
| BASP1 | SPON2 | 0.759437 | 3 | 0 | 3 |
| BASP1 | PDE7A | 0.752123 | 7 | 0 | 7 |
| BASP1 | LRRC8C | 0.735098 | 3 | 0 | 3 |
| BASP1 | FAM89A | 0.729938 | 3 | 0 | 3 |
| BASP1 | CDCA2 | 0.723727 | 4 | 0 | 4 |
| BASP1 | FMNL2 | 0.716931 | 7 | 0 | 7 |
| BASP1 | ITGA3 | 0.71368 | 9 | 0 | 8 |
| BASP1 | DCBLD1 | 0.711014 | 8 | 0 | 8 |
| BASP1 | KLHL13 | 0.708884 | 3 | 0 | 3 |
| BASP1 | WDR54 | 0.705718 | 7 | 0 | 7 |
| BASP1 | LGALS8 | 0.702482 | 4 | 0 | 3 |
| BASP1 | PDIA5 | 0.696476 | 3 | 0 | 3 |
| BASP1 | RHBDD2 | 0.690464 | 4 | 0 | 4 |
| BASP1 | IPO4 | 0.690138 | 4 | 0 | 3 |
| BASP1 | TTC8 | 0.689874 | 3 | 0 | 3 |
| BASP1 | JAGN1 | 0.685383 | 3 | 0 | 3 |
| BASP1 | SEC22C | 0.685192 | 4 | 0 | 3 |
| BASP1 | PSMB2 | 0.684926 | 7 | 0 | 7 |
| BASP1 | RNF4 | 0.684703 | 3 | 0 | 3 |
For details and further investigation, click here