| Full name: Bardet-Biedl syndrome 2 | Alias Symbol: | ||
| Type: protein-coding gene | Cytoband: 16q13 | ||
| Entrez ID: 583 | HGNC ID: HGNC:967 | Ensembl Gene: ENSG00000125124 | OMIM ID: 606151 |
Expression of BBS2:
| Dataset | Gene | EntrezID | Probe | Log2FC | Adj.pValue | Expression |
|---|---|---|---|---|---|---|
| GSE17351 | BBS2 | 583 | 223227_at | -0.6257 | 0.0823 | |
| GSE26886 | BBS2 | 583 | 223227_at | -0.4593 | 0.1958 | |
| GSE45670 | BBS2 | 583 | 223227_at | -0.7286 | 0.0000 | |
| GSE53622 | BBS2 | 583 | 41204 | -0.4907 | 0.0000 | |
| GSE53624 | BBS2 | 583 | 41204 | -0.5862 | 0.0000 | |
| GSE63941 | BBS2 | 583 | 223227_at | -0.5810 | 0.1333 | |
| GSE77861 | BBS2 | 583 | 223227_at | 0.0117 | 0.9723 | |
| GSE97050 | BBS2 | 583 | A_23_P106835 | -0.3364 | 0.2585 | |
| SRP007169 | BBS2 | 583 | RNAseq | -0.7962 | 0.0212 | |
| SRP008496 | BBS2 | 583 | RNAseq | -0.6327 | 0.0167 | |
| SRP064894 | BBS2 | 583 | RNAseq | -0.6171 | 0.0016 | |
| SRP133303 | BBS2 | 583 | RNAseq | -0.6582 | 0.0000 | |
| SRP159526 | BBS2 | 583 | RNAseq | -0.3674 | 0.1534 | |
| SRP193095 | BBS2 | 583 | RNAseq | -0.5410 | 0.0000 | |
| SRP219564 | BBS2 | 583 | RNAseq | -0.6124 | 0.0754 | |
| TCGA | BBS2 | 583 | RNAseq | -0.1629 | 0.0035 |
Upregulated datasets: 0; Downregulated datasets: 0.
Survival by BBS2 expression:
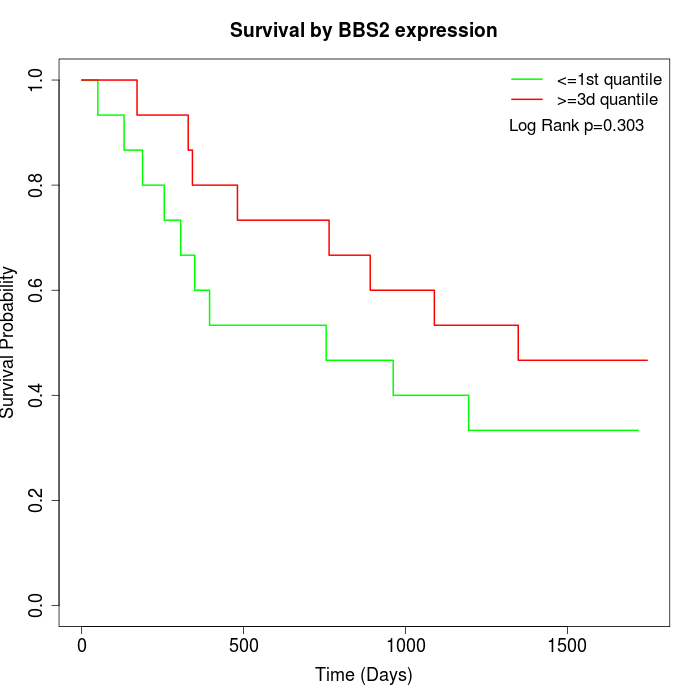 | 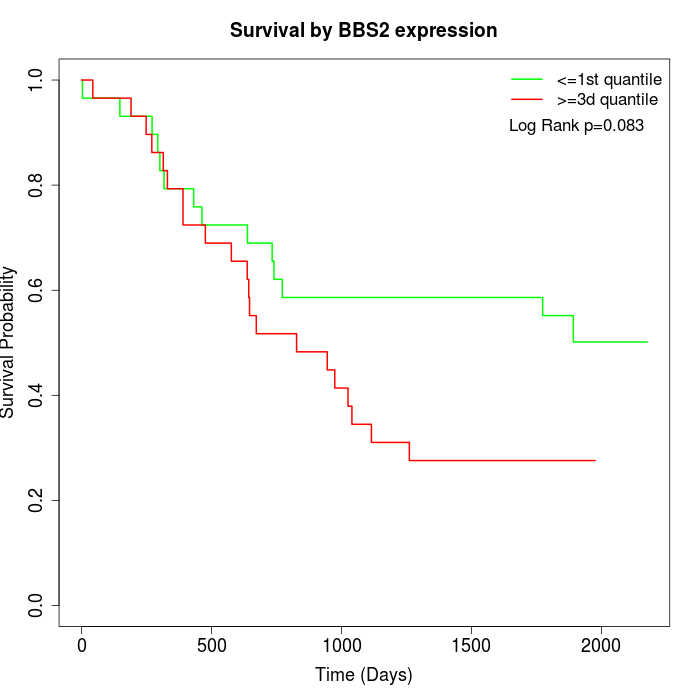 | 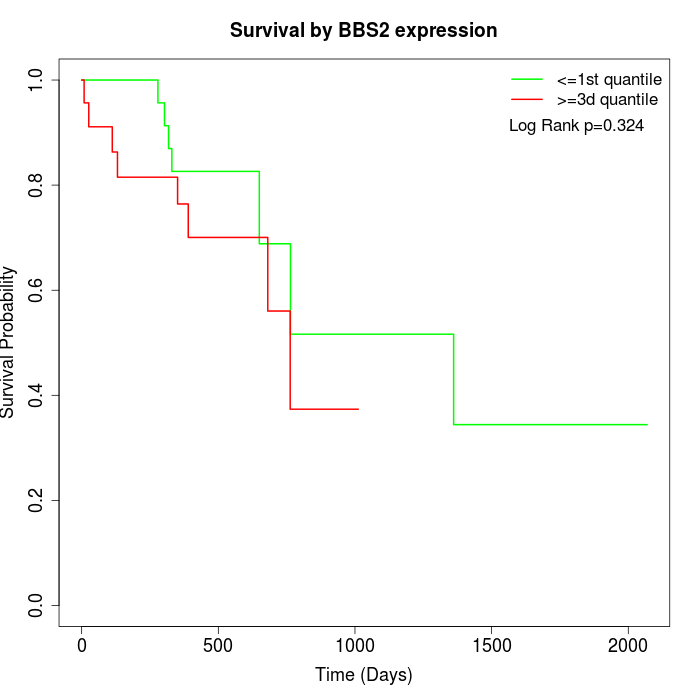 |
| GSE53622 | GSE53624 | TCGA |
Note: Click image to view full size file.
Copy number change of BBS2:
| Dataset | Gene | EntrezID | Gain | Loss | Normal | Detail |
|---|---|---|---|---|---|---|
| GSE15526 | BBS2 | 583 | 5 | 0 | 25 | |
| GSE20123 | BBS2 | 583 | 5 | 0 | 25 | |
| GSE43470 | BBS2 | 583 | 2 | 7 | 34 | |
| GSE46452 | BBS2 | 583 | 38 | 1 | 20 | |
| GSE47630 | BBS2 | 583 | 10 | 8 | 22 | |
| GSE54993 | BBS2 | 583 | 2 | 4 | 64 | |
| GSE54994 | BBS2 | 583 | 7 | 10 | 36 | |
| GSE60625 | BBS2 | 583 | 4 | 0 | 7 | |
| GSE74703 | BBS2 | 583 | 2 | 4 | 30 | |
| GSE74704 | BBS2 | 583 | 4 | 0 | 16 | |
| TCGA | BBS2 | 583 | 25 | 12 | 59 |
Total number of gains: 104; Total number of losses: 46; Total Number of normals: 338.
Somatic mutations of BBS2:
Generating mutation plots.
Highly correlated genes for BBS2:
Showing top 20/229 corelated genes with mean PCC>0.5.
| Gene1 | Gene2 | Mean PCC | Num. Datasets | Num. PCC<0 | Num. PCC>0.5 |
|---|---|---|---|---|---|
| BBS2 | DEPTOR | 0.761115 | 3 | 0 | 3 |
| BBS2 | RPL29 | 0.690023 | 4 | 0 | 4 |
| BBS2 | MYZAP | 0.637237 | 3 | 0 | 3 |
| BBS2 | MPC1 | 0.636131 | 5 | 0 | 5 |
| BBS2 | PRRT2 | 0.635977 | 3 | 0 | 3 |
| BBS2 | ACAT1 | 0.634681 | 5 | 0 | 4 |
| BBS2 | RPL14 | 0.634486 | 3 | 0 | 3 |
| BBS2 | CIPC | 0.629918 | 5 | 0 | 4 |
| BBS2 | SSBP2 | 0.629233 | 4 | 0 | 3 |
| BBS2 | MSRA | 0.622941 | 4 | 0 | 3 |
| BBS2 | GOLGA4 | 0.621383 | 4 | 0 | 3 |
| BBS2 | PDK4 | 0.620804 | 6 | 0 | 5 |
| BBS2 | STX7 | 0.619938 | 5 | 0 | 4 |
| BBS2 | STARD9 | 0.617958 | 4 | 0 | 3 |
| BBS2 | HSPB8 | 0.611822 | 4 | 0 | 3 |
| BBS2 | FBXW11 | 0.611525 | 4 | 0 | 4 |
| BBS2 | OXR1 | 0.609832 | 5 | 0 | 4 |
| BBS2 | RGS7BP | 0.609383 | 5 | 0 | 5 |
| BBS2 | ITM2A | 0.608336 | 4 | 0 | 3 |
| BBS2 | CCNG1 | 0.607121 | 5 | 0 | 5 |
For details and further investigation, click here