| Full name: betaine--homocysteine S-methyltransferase | Alias Symbol: BHMT1 | ||
| Type: protein-coding gene | Cytoband: 5q14.1 | ||
| Entrez ID: 635 | HGNC ID: HGNC:1047 | Ensembl Gene: ENSG00000145692 | OMIM ID: 602888 |
| Related drugs: BETAINE HYDROCHLORIDE... [more] | |||
Expression of BHMT:
| Dataset | Gene | EntrezID | Probe | Log2FC | Adj.pValue | Expression |
|---|---|---|---|---|---|---|
| GSE17351 | BHMT | 635 | 206119_at | -0.0810 | 0.8920 | |
| GSE20347 | BHMT | 635 | 206119_at | -0.2008 | 0.0919 | |
| GSE23400 | BHMT | 635 | 206119_at | -0.4249 | 0.0000 | |
| GSE26886 | BHMT | 635 | 206119_at | 0.2067 | 0.4061 | |
| GSE29001 | BHMT | 635 | 206119_at | -0.0382 | 0.8890 | |
| GSE38129 | BHMT | 635 | 206119_at | -0.3998 | 0.0054 | |
| GSE45670 | BHMT | 635 | 206119_at | 0.2449 | 0.3235 | |
| GSE53622 | BHMT | 635 | 80764 | 0.2797 | 0.4016 | |
| GSE53624 | BHMT | 635 | 80764 | 0.7842 | 0.0000 | |
| GSE63941 | BHMT | 635 | 206119_at | 0.0942 | 0.7644 | |
| GSE77861 | BHMT | 635 | 206119_at | 0.0753 | 0.7729 | |
| GSE97050 | BHMT | 635 | A_24_P257511 | -0.3692 | 0.2839 | |
| SRP159526 | BHMT | 635 | RNAseq | 2.3343 | 0.0005 | |
| TCGA | BHMT | 635 | RNAseq | -1.5604 | 0.0012 |
Upregulated datasets: 1; Downregulated datasets: 1.
Survival by BHMT expression:
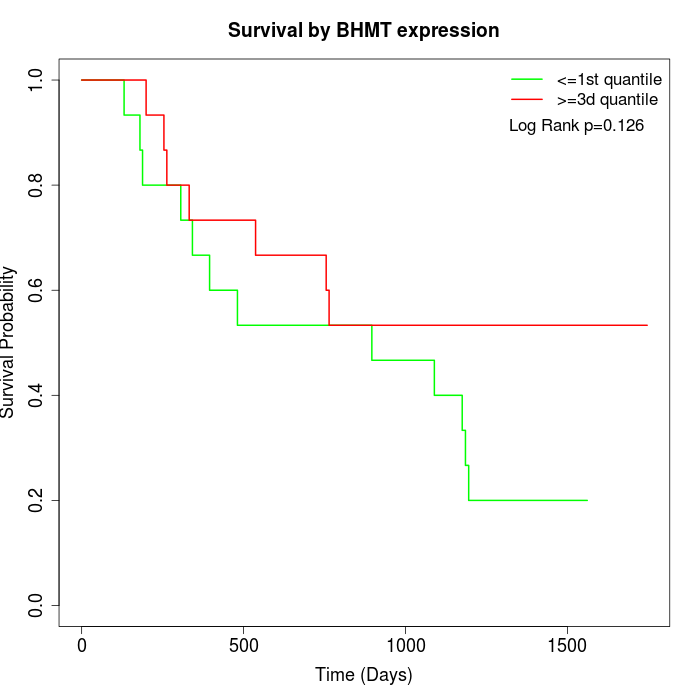 |  |  |
| GSE53622 | GSE53624 | TCGA |
Note: Click image to view full size file.
Copy number change of BHMT:
| Dataset | Gene | EntrezID | Gain | Loss | Normal | Detail |
|---|---|---|---|---|---|---|
| GSE15526 | BHMT | 635 | 1 | 13 | 16 | |
| GSE20123 | BHMT | 635 | 1 | 13 | 16 | |
| GSE43470 | BHMT | 635 | 1 | 13 | 29 | |
| GSE46452 | BHMT | 635 | 0 | 28 | 31 | |
| GSE47630 | BHMT | 635 | 1 | 19 | 20 | |
| GSE54993 | BHMT | 635 | 8 | 1 | 61 | |
| GSE54994 | BHMT | 635 | 1 | 19 | 33 | |
| GSE60625 | BHMT | 635 | 0 | 0 | 11 | |
| GSE74703 | BHMT | 635 | 1 | 9 | 26 | |
| GSE74704 | BHMT | 635 | 1 | 6 | 13 | |
| TCGA | BHMT | 635 | 5 | 49 | 42 |
Total number of gains: 20; Total number of losses: 170; Total Number of normals: 298.
Somatic mutations of BHMT:
Generating mutation plots.
Highly correlated genes for BHMT:
Showing top 20/143 corelated genes with mean PCC>0.5.
| Gene1 | Gene2 | Mean PCC | Num. Datasets | Num. PCC<0 | Num. PCC>0.5 |
|---|---|---|---|---|---|
| BHMT | HOGA1 | 0.709205 | 3 | 0 | 3 |
| BHMT | GABRA2 | 0.644587 | 4 | 0 | 3 |
| BHMT | LYPD6 | 0.643247 | 3 | 0 | 3 |
| BHMT | STXBP6 | 0.640656 | 4 | 0 | 4 |
| BHMT | VIPR2 | 0.640246 | 5 | 0 | 5 |
| BHMT | CDH19 | 0.639647 | 4 | 0 | 3 |
| BHMT | DCX | 0.631376 | 3 | 0 | 3 |
| BHMT | XPNPEP2 | 0.631305 | 3 | 0 | 3 |
| BHMT | NMNAT2 | 0.616781 | 4 | 0 | 4 |
| BHMT | ZMAT4 | 0.613047 | 5 | 0 | 5 |
| BHMT | ACSL6 | 0.607916 | 4 | 0 | 4 |
| BHMT | SLC8A2 | 0.602263 | 4 | 0 | 3 |
| BHMT | LINC00950 | 0.601912 | 5 | 0 | 4 |
| BHMT | MYOZ3 | 0.601901 | 4 | 0 | 3 |
| BHMT | NRK | 0.599818 | 4 | 0 | 3 |
| BHMT | SLCO5A1 | 0.595409 | 3 | 0 | 3 |
| BHMT | COX5B | 0.592154 | 4 | 0 | 3 |
| BHMT | PHLDB1 | 0.591148 | 4 | 0 | 4 |
| BHMT | ARHGEF28 | 0.590515 | 3 | 0 | 3 |
| BHMT | GPC3 | 0.589849 | 4 | 0 | 3 |
For details and further investigation, click here