| Full name: calcyclin binding protein | Alias Symbol: SIP|S100A6BP | ||
| Type: protein-coding gene | Cytoband: 1q25.1 | ||
| Entrez ID: 27101 | HGNC ID: HGNC:30423 | Ensembl Gene: ENSG00000116161 | OMIM ID: 606186 |
Screen Evidence:
| |||
Expression of CACYBP:
| Dataset | Gene | EntrezID | Probe | Log2FC | Adj.pValue | Expression |
|---|---|---|---|---|---|---|
| GSE17351 | CACYBP | 27101 | 201381_x_at | 0.8403 | 0.0058 | |
| GSE20347 | CACYBP | 27101 | 201381_x_at | 0.8689 | 0.0001 | |
| GSE23400 | CACYBP | 27101 | 211761_s_at | 0.6139 | 0.0000 | |
| GSE26886 | CACYBP | 27101 | 211761_s_at | 0.6571 | 0.0002 | |
| GSE29001 | CACYBP | 27101 | 211761_s_at | 0.7517 | 0.0225 | |
| GSE38129 | CACYBP | 27101 | 201381_x_at | 0.8907 | 0.0000 | |
| GSE45670 | CACYBP | 27101 | 211761_s_at | 0.3202 | 0.1813 | |
| GSE53622 | CACYBP | 27101 | 26055 | 0.6084 | 0.0000 | |
| GSE53624 | CACYBP | 27101 | 26055 | 0.8429 | 0.0000 | |
| GSE63941 | CACYBP | 27101 | 201381_x_at | 1.0361 | 0.0005 | |
| GSE77861 | CACYBP | 27101 | 201381_x_at | 0.6128 | 0.0005 | |
| GSE97050 | CACYBP | 27101 | A_32_P114574 | 0.3376 | 0.3283 | |
| SRP007169 | CACYBP | 27101 | RNAseq | -0.1988 | 0.6470 | |
| SRP008496 | CACYBP | 27101 | RNAseq | 0.3405 | 0.3273 | |
| SRP064894 | CACYBP | 27101 | RNAseq | 0.5238 | 0.0048 | |
| SRP133303 | CACYBP | 27101 | RNAseq | 0.6314 | 0.0000 | |
| SRP159526 | CACYBP | 27101 | RNAseq | 1.0073 | 0.0005 | |
| SRP193095 | CACYBP | 27101 | RNAseq | 0.3436 | 0.0089 | |
| SRP219564 | CACYBP | 27101 | RNAseq | 0.4623 | 0.2528 | |
| TCGA | CACYBP | 27101 | RNAseq | 0.2813 | 0.0000 |
Upregulated datasets: 2; Downregulated datasets: 0.
Survival by CACYBP expression:
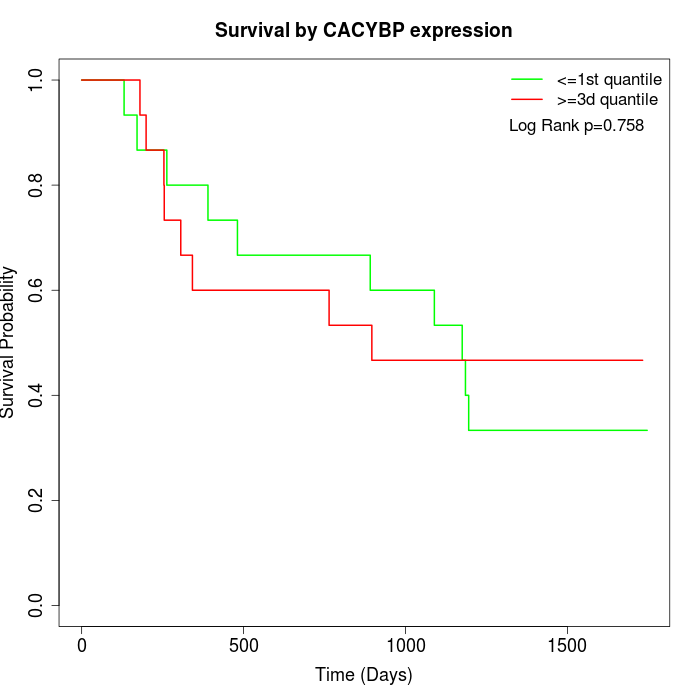 | 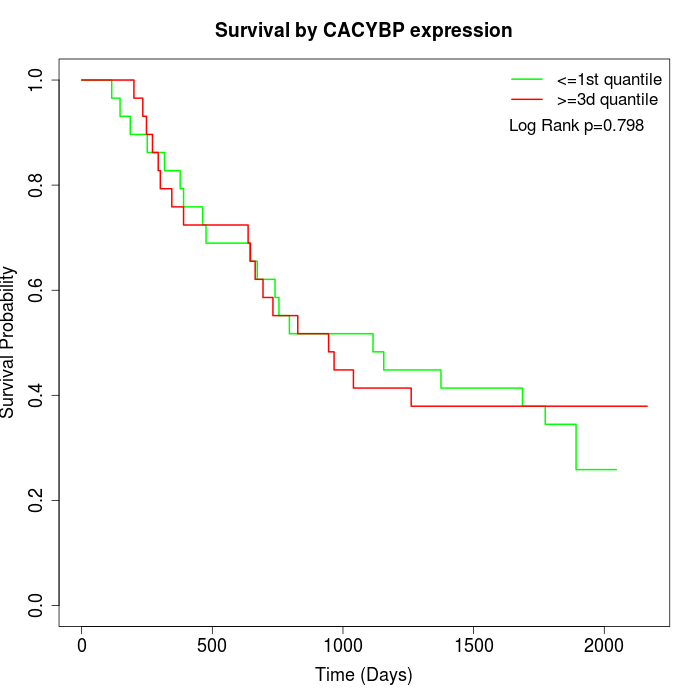 | 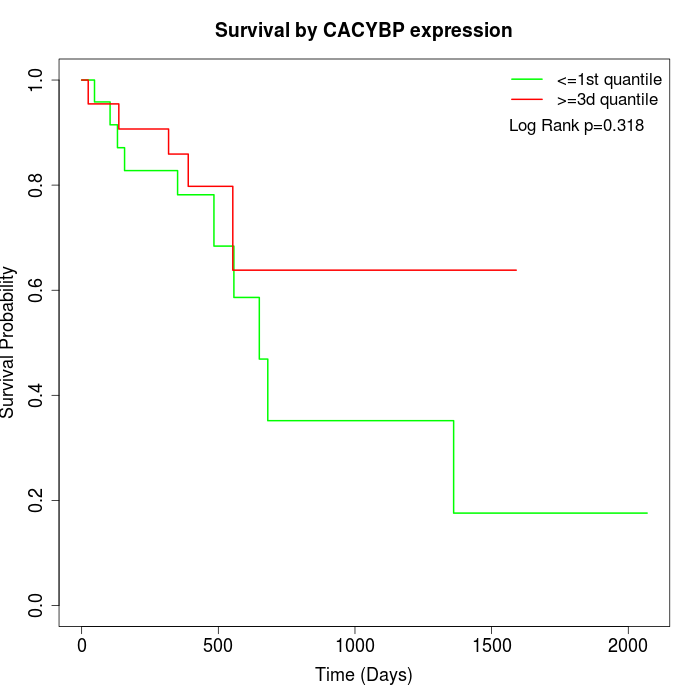 |
| GSE53622 | GSE53624 | TCGA |
Note: Click image to view full size file.
Copy number change of CACYBP:
| Dataset | Gene | EntrezID | Gain | Loss | Normal | Detail |
|---|---|---|---|---|---|---|
| GSE15526 | CACYBP | 27101 | 12 | 0 | 18 | |
| GSE20123 | CACYBP | 27101 | 12 | 0 | 18 | |
| GSE43470 | CACYBP | 27101 | 7 | 2 | 34 | |
| GSE46452 | CACYBP | 27101 | 3 | 1 | 55 | |
| GSE47630 | CACYBP | 27101 | 14 | 0 | 26 | |
| GSE54993 | CACYBP | 27101 | 0 | 6 | 64 | |
| GSE54994 | CACYBP | 27101 | 15 | 0 | 38 | |
| GSE60625 | CACYBP | 27101 | 0 | 0 | 11 | |
| GSE74703 | CACYBP | 27101 | 7 | 2 | 27 | |
| GSE74704 | CACYBP | 27101 | 5 | 0 | 15 | |
| TCGA | CACYBP | 27101 | 41 | 3 | 52 |
Total number of gains: 116; Total number of losses: 14; Total Number of normals: 358.
Somatic mutations of CACYBP:
Generating mutation plots.
Highly correlated genes for CACYBP:
Showing top 20/1904 corelated genes with mean PCC>0.5.
| Gene1 | Gene2 | Mean PCC | Num. Datasets | Num. PCC<0 | Num. PCC>0.5 |
|---|---|---|---|---|---|
| CACYBP | HSPE1 | 0.771867 | 13 | 0 | 13 |
| CACYBP | HSPD1 | 0.768905 | 12 | 0 | 12 |
| CACYBP | SNRPE | 0.766824 | 12 | 0 | 11 |
| CACYBP | MMS22L | 0.764279 | 3 | 0 | 3 |
| CACYBP | FHL3 | 0.762044 | 3 | 0 | 3 |
| CACYBP | TMEM63B | 0.761163 | 3 | 0 | 3 |
| CACYBP | CPT1A | 0.755908 | 4 | 0 | 4 |
| CACYBP | PFDN2 | 0.75581 | 11 | 0 | 10 |
| CACYBP | FADS1 | 0.755585 | 3 | 0 | 3 |
| CACYBP | TSEN15 | 0.752989 | 6 | 0 | 6 |
| CACYBP | E2F6 | 0.752884 | 11 | 0 | 11 |
| CACYBP | CMTM4 | 0.74904 | 4 | 0 | 4 |
| CACYBP | LRRC58 | 0.748851 | 5 | 0 | 5 |
| CACYBP | C17orf67 | 0.7445 | 3 | 0 | 3 |
| CACYBP | MSH6 | 0.742117 | 12 | 0 | 11 |
| CACYBP | GMPS | 0.74045 | 13 | 0 | 12 |
| CACYBP | GPR153 | 0.740429 | 4 | 0 | 4 |
| CACYBP | CKS1B | 0.73856 | 13 | 0 | 12 |
| CACYBP | BID | 0.737859 | 10 | 0 | 9 |
| CACYBP | C1orf112 | 0.736852 | 10 | 0 | 9 |
For details and further investigation, click here