| Full name: carnitine palmitoyltransferase 1A | Alias Symbol: CPT1-L|L-CPT1 | ||
| Type: protein-coding gene | Cytoband: 11q13.3 | ||
| Entrez ID: 1374 | HGNC ID: HGNC:2328 | Ensembl Gene: ENSG00000110090 | OMIM ID: 600528 |
| Related drugs: PERHEXILINE... [more] | |||
CPT1A involved pathways:
| KEGG pathway | Description | View |
|---|---|---|
| hsa03320 | PPAR signaling pathway | |
| hsa04152 | AMPK signaling pathway | |
| hsa04920 | Adipocytokine signaling pathway | |
| hsa04922 | Glucagon signaling pathway | |
| hsa04931 | Insulin resistance |
Expression of CPT1A:
| Dataset | Gene | EntrezID | Probe | Log2FC | Adj.pValue | Expression |
|---|---|---|---|---|---|---|
| GSE17351 | CPT1A | 1374 | 203633_at | 0.9044 | 0.4646 | |
| GSE20347 | CPT1A | 1374 | 203633_at | 0.6280 | 0.1484 | |
| GSE23400 | CPT1A | 1374 | 203633_at | 0.0741 | 0.5036 | |
| GSE26886 | CPT1A | 1374 | 203633_at | 1.3359 | 0.0001 | |
| GSE29001 | CPT1A | 1374 | 203633_at | -0.2127 | 0.2521 | |
| GSE38129 | CPT1A | 1374 | 203633_at | 0.3238 | 0.2806 | |
| GSE45670 | CPT1A | 1374 | 203633_at | -0.4659 | 0.1478 | |
| GSE53622 | CPT1A | 1374 | 31103 | 0.3343 | 0.0076 | |
| GSE53624 | CPT1A | 1374 | 31103 | 0.5009 | 0.0000 | |
| GSE63941 | CPT1A | 1374 | 203633_at | 0.3751 | 0.7057 | |
| GSE77861 | CPT1A | 1374 | 203633_at | 0.8042 | 0.0041 | |
| GSE97050 | CPT1A | 1374 | A_23_P104563 | 0.1731 | 0.7619 | |
| SRP007169 | CPT1A | 1374 | RNAseq | 0.3838 | 0.2849 | |
| SRP008496 | CPT1A | 1374 | RNAseq | 0.3182 | 0.3098 | |
| SRP064894 | CPT1A | 1374 | RNAseq | 0.0187 | 0.9514 | |
| SRP133303 | CPT1A | 1374 | RNAseq | 0.6176 | 0.1055 | |
| SRP159526 | CPT1A | 1374 | RNAseq | 1.3682 | 0.0022 | |
| SRP193095 | CPT1A | 1374 | RNAseq | 0.8569 | 0.0023 | |
| SRP219564 | CPT1A | 1374 | RNAseq | 0.5448 | 0.3979 | |
| TCGA | CPT1A | 1374 | RNAseq | -0.1377 | 0.1659 |
Upregulated datasets: 2; Downregulated datasets: 0.
Survival by CPT1A expression:
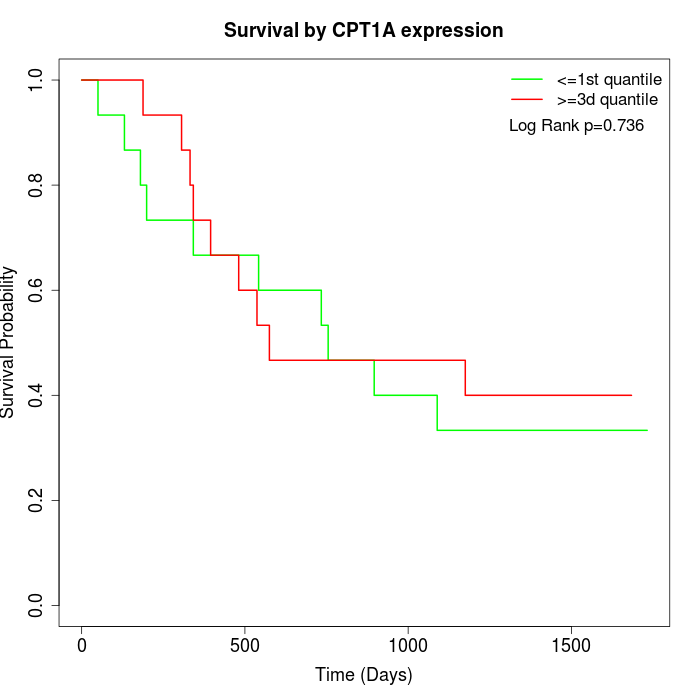 | 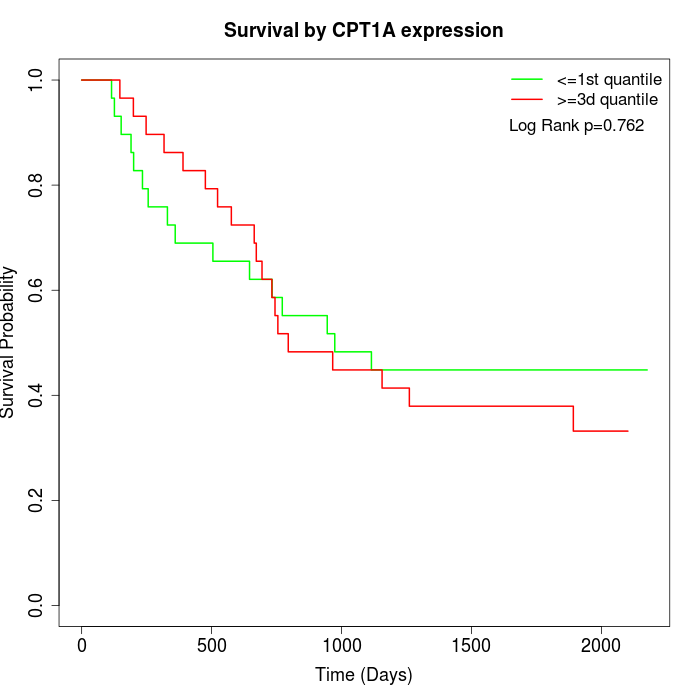 | 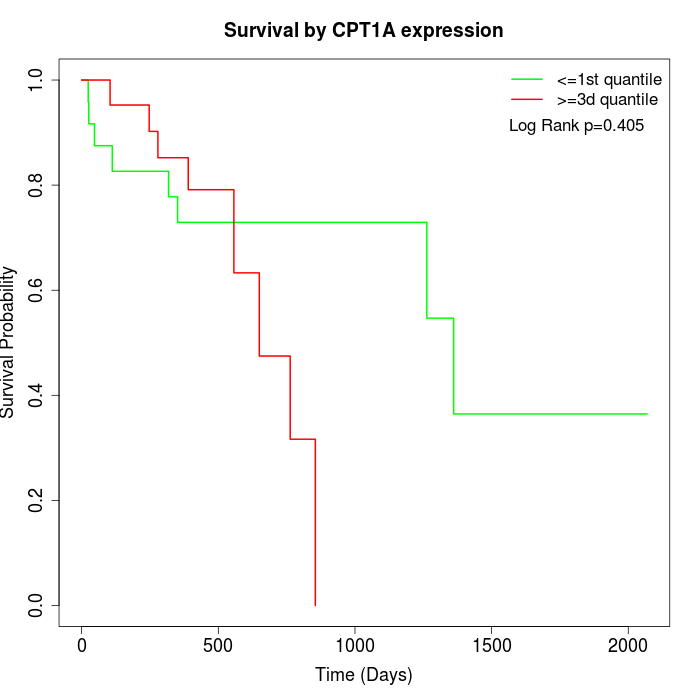 |
| GSE53622 | GSE53624 | TCGA |
Note: Click image to view full size file.
Copy number change of CPT1A:
| Dataset | Gene | EntrezID | Gain | Loss | Normal | Detail |
|---|---|---|---|---|---|---|
| GSE15526 | CPT1A | 1374 | 13 | 2 | 15 | |
| GSE20123 | CPT1A | 1374 | 13 | 2 | 15 | |
| GSE43470 | CPT1A | 1374 | 10 | 3 | 30 | |
| GSE46452 | CPT1A | 1374 | 28 | 2 | 29 | |
| GSE47630 | CPT1A | 1374 | 15 | 3 | 22 | |
| GSE54993 | CPT1A | 1374 | 1 | 15 | 54 | |
| GSE54994 | CPT1A | 1374 | 22 | 4 | 27 | |
| GSE60625 | CPT1A | 1374 | 0 | 3 | 8 | |
| GSE74703 | CPT1A | 1374 | 8 | 2 | 26 | |
| GSE74704 | CPT1A | 1374 | 9 | 0 | 11 | |
| TCGA | CPT1A | 1374 | 44 | 6 | 46 |
Total number of gains: 163; Total number of losses: 42; Total Number of normals: 283.
Somatic mutations of CPT1A:
Generating mutation plots.
Highly correlated genes for CPT1A:
Showing top 20/747 corelated genes with mean PCC>0.5.
| Gene1 | Gene2 | Mean PCC | Num. Datasets | Num. PCC<0 | Num. PCC>0.5 |
|---|---|---|---|---|---|
| CPT1A | KRTCAP2 | 0.845068 | 3 | 0 | 3 |
| CPT1A | BAD | 0.844211 | 3 | 0 | 3 |
| CPT1A | SNRPE | 0.840975 | 3 | 0 | 3 |
| CPT1A | SRRT | 0.836709 | 3 | 0 | 3 |
| CPT1A | TIGD1 | 0.836253 | 3 | 0 | 3 |
| CPT1A | SEMA3C | 0.832892 | 3 | 0 | 3 |
| CPT1A | TUBA1B | 0.825114 | 3 | 0 | 3 |
| CPT1A | TTC7B | 0.814349 | 3 | 0 | 3 |
| CPT1A | DDX55 | 0.811849 | 3 | 0 | 3 |
| CPT1A | GALNT18 | 0.810262 | 3 | 0 | 3 |
| CPT1A | TRMT6 | 0.807164 | 3 | 0 | 3 |
| CPT1A | FH | 0.802107 | 3 | 0 | 3 |
| CPT1A | METTL23 | 0.801716 | 3 | 0 | 3 |
| CPT1A | NUCKS1 | 0.800036 | 3 | 0 | 3 |
| CPT1A | NIPA1 | 0.797464 | 3 | 0 | 3 |
| CPT1A | ACBD6 | 0.797161 | 3 | 0 | 3 |
| CPT1A | CERS2 | 0.787783 | 4 | 0 | 4 |
| CPT1A | SMYD2 | 0.787384 | 3 | 0 | 3 |
| CPT1A | FOXN2 | 0.782798 | 3 | 0 | 3 |
| CPT1A | PLXNA1 | 0.778826 | 3 | 0 | 3 |
For details and further investigation, click here