| Full name: cancer susceptibility 15 | Alias Symbol: lnc-SOX4-1 | ||
| Type: non-coding RNA | Cytoband: 6p22.3 | ||
| Entrez ID: 401237 | HGNC ID: HGNC:28245 | Ensembl Gene: ENSG00000272168 | OMIM ID: 616610 |
Expression of CASC15:
| Dataset | Gene | EntrezID | Probe | Log2FC | Adj.pValue | Expression |
|---|---|---|---|---|---|---|
| GSE17351 | CASC15 | 401237 | 229280_s_at | 0.5900 | 0.1772 | |
| GSE26886 | CASC15 | 401237 | 229280_s_at | 0.8421 | 0.0169 | |
| GSE45670 | CASC15 | 401237 | 229280_s_at | 0.2603 | 0.2726 | |
| GSE53622 | CASC15 | 401237 | 10214 | -0.0954 | 0.0592 | |
| GSE53624 | CASC15 | 401237 | 10214 | -0.1262 | 0.1093 | |
| GSE63941 | CASC15 | 401237 | 229280_s_at | -1.5838 | 0.0045 | |
| GSE77861 | CASC15 | 401237 | 229280_s_at | 0.4294 | 0.0168 | |
| SRP007169 | CASC15 | 401237 | RNAseq | 4.2088 | 0.0000 | |
| SRP008496 | CASC15 | 401237 | RNAseq | 4.6252 | 0.0000 | |
| SRP064894 | CASC15 | 401237 | RNAseq | 1.3237 | 0.0000 | |
| SRP133303 | CASC15 | 401237 | RNAseq | 0.8235 | 0.0001 | |
| SRP159526 | CASC15 | 401237 | RNAseq | 1.8259 | 0.0017 | |
| SRP193095 | CASC15 | 401237 | RNAseq | 0.9429 | 0.0000 | |
| SRP219564 | CASC15 | 401237 | RNAseq | 0.7359 | 0.0749 |
Upregulated datasets: 4; Downregulated datasets: 1.
Survival by CASC15 expression:
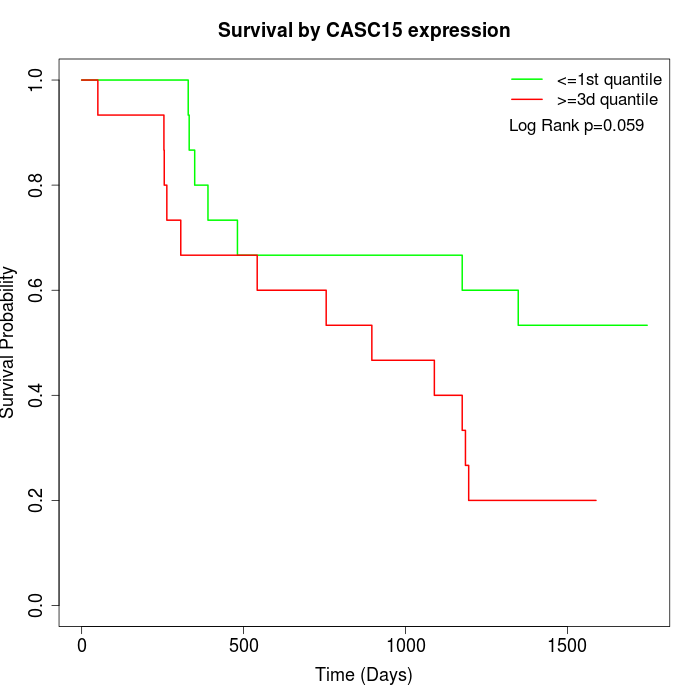 | 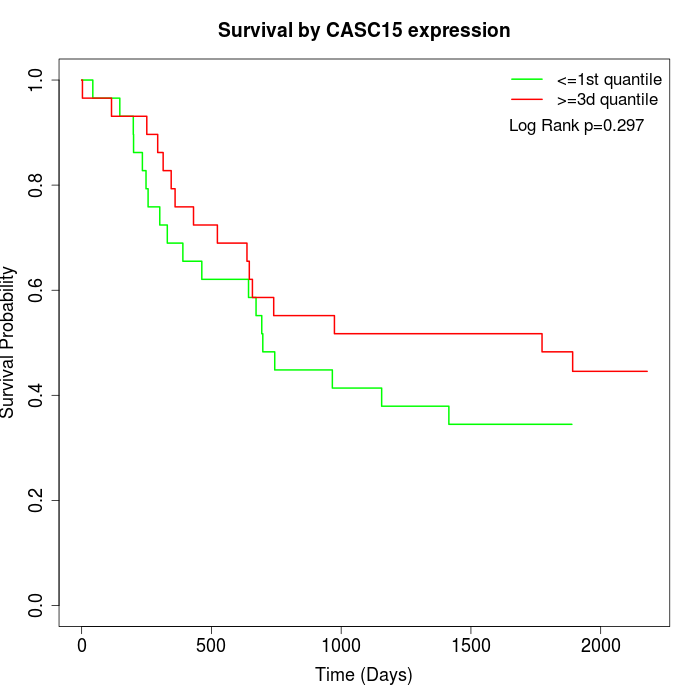 |
| GSE53622 | GSE53624 |
Note: Click image to view full size file.
Copy number change of CASC15:
| Dataset | Gene | EntrezID | Gain | Loss | Normal | Detail |
|---|---|---|---|---|---|---|
| GSE15526 | CASC15 | 401237 | 4 | 3 | 23 | |
| GSE20123 | CASC15 | 401237 | 4 | 3 | 23 | |
| GSE43470 | CASC15 | 401237 | 10 | 0 | 33 | |
| GSE46452 | CASC15 | 401237 | 1 | 9 | 49 | |
| GSE47630 | CASC15 | 401237 | 10 | 4 | 26 | |
| GSE54993 | CASC15 | 401237 | 1 | 1 | 68 | |
| GSE54994 | CASC15 | 401237 | 12 | 4 | 37 | |
| GSE60625 | CASC15 | 401237 | 0 | 1 | 10 | |
| GSE74703 | CASC15 | 401237 | 9 | 0 | 27 | |
| GSE74704 | CASC15 | 401237 | 1 | 1 | 18 |
Total number of gains: 52; Total number of losses: 26; Total Number of normals: 314.
Somatic mutations of CASC15:
Generating mutation plots.
Highly correlated genes for CASC15:
Showing top 20/210 corelated genes with mean PCC>0.5.
| Gene1 | Gene2 | Mean PCC | Num. Datasets | Num. PCC<0 | Num. PCC>0.5 |
|---|---|---|---|---|---|
| CASC15 | MARK4 | 0.785778 | 3 | 0 | 3 |
| CASC15 | ZDHHC22 | 0.768409 | 3 | 0 | 3 |
| CASC15 | ZNF236 | 0.757461 | 3 | 0 | 3 |
| CASC15 | FREM2 | 0.734809 | 4 | 0 | 3 |
| CASC15 | MYOD1 | 0.726989 | 3 | 0 | 3 |
| CASC15 | FGF19 | 0.721196 | 4 | 0 | 3 |
| CASC15 | MPPED1 | 0.712862 | 6 | 0 | 5 |
| CASC15 | LHX9 | 0.712381 | 3 | 0 | 3 |
| CASC15 | SOST | 0.712027 | 4 | 0 | 3 |
| CASC15 | ZC3H18 | 0.709009 | 4 | 0 | 4 |
| CASC15 | KIRREL2 | 0.697236 | 3 | 0 | 3 |
| CASC15 | RASD1 | 0.696442 | 3 | 0 | 3 |
| CASC15 | HDAC4 | 0.694549 | 3 | 0 | 3 |
| CASC15 | CREB3L3 | 0.678 | 3 | 0 | 3 |
| CASC15 | SPSB4 | 0.674425 | 3 | 0 | 3 |
| CASC15 | TP53I13 | 0.673318 | 4 | 0 | 4 |
| CASC15 | NFRKB | 0.671879 | 3 | 0 | 3 |
| CASC15 | ALPL | 0.671381 | 4 | 0 | 4 |
| CASC15 | ODC1 | 0.671108 | 4 | 0 | 4 |
| CASC15 | RIMBP2 | 0.670818 | 3 | 0 | 3 |
For details and further investigation, click here