| Full name: cyclin B1 interacting protein 1 | Alias Symbol: HEI10 | ||
| Type: protein-coding gene | Cytoband: 14q11.2 | ||
| Entrez ID: 57820 | HGNC ID: HGNC:19437 | Ensembl Gene: ENSG00000100814 | OMIM ID: 608249 |
Expression of CCNB1IP1:
| Dataset | Gene | EntrezID | Probe | Log2FC | Adj.pValue | Expression |
|---|---|---|---|---|---|---|
| GSE17351 | CCNB1IP1 | 57820 | 217988_at | -0.1829 | 0.7709 | |
| GSE20347 | CCNB1IP1 | 57820 | 217988_at | 0.7700 | 0.0005 | |
| GSE23400 | CCNB1IP1 | 57820 | 217988_at | 0.8825 | 0.0000 | |
| GSE26886 | CCNB1IP1 | 57820 | 217988_at | 1.4751 | 0.0000 | |
| GSE29001 | CCNB1IP1 | 57820 | 217988_at | 0.4327 | 0.2369 | |
| GSE38129 | CCNB1IP1 | 57820 | 217988_at | 0.7804 | 0.0000 | |
| GSE45670 | CCNB1IP1 | 57820 | 217988_at | 0.0959 | 0.7244 | |
| GSE53622 | CCNB1IP1 | 57820 | 65188 | 0.4895 | 0.0000 | |
| GSE53624 | CCNB1IP1 | 57820 | 65188 | 0.6034 | 0.0000 | |
| GSE63941 | CCNB1IP1 | 57820 | 217988_at | 1.5223 | 0.0595 | |
| GSE77861 | CCNB1IP1 | 57820 | 217988_at | 0.9520 | 0.0170 | |
| GSE97050 | CCNB1IP1 | 57820 | A_23_P76882 | 0.1749 | 0.3721 | |
| SRP007169 | CCNB1IP1 | 57820 | RNAseq | 0.8762 | 0.0699 | |
| SRP008496 | CCNB1IP1 | 57820 | RNAseq | 0.9320 | 0.0015 | |
| SRP064894 | CCNB1IP1 | 57820 | RNAseq | 0.2733 | 0.2389 | |
| SRP133303 | CCNB1IP1 | 57820 | RNAseq | 0.1776 | 0.2595 | |
| SRP159526 | CCNB1IP1 | 57820 | RNAseq | 0.5587 | 0.0099 | |
| SRP193095 | CCNB1IP1 | 57820 | RNAseq | 0.2621 | 0.0847 | |
| SRP219564 | CCNB1IP1 | 57820 | RNAseq | 0.3188 | 0.4171 | |
| TCGA | CCNB1IP1 | 57820 | RNAseq | 0.1667 | 0.0164 |
Upregulated datasets: 1; Downregulated datasets: 0.
Survival by CCNB1IP1 expression:
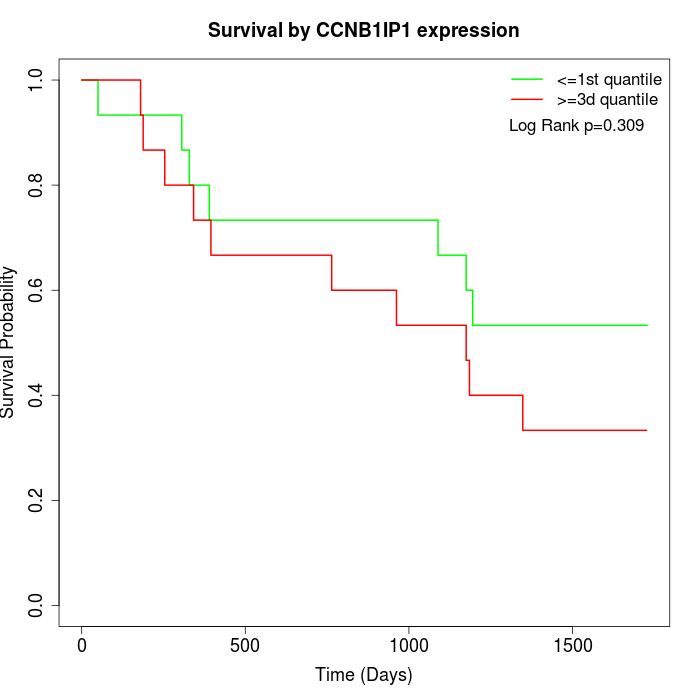 | 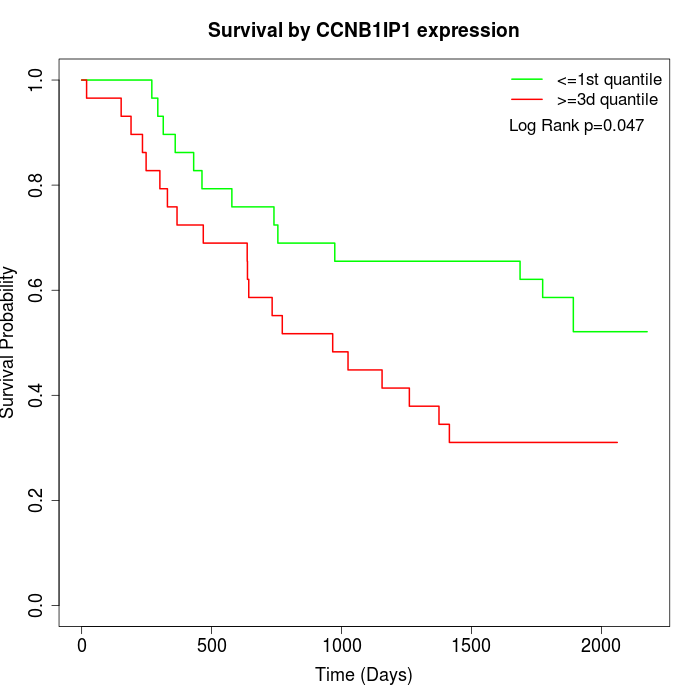 | 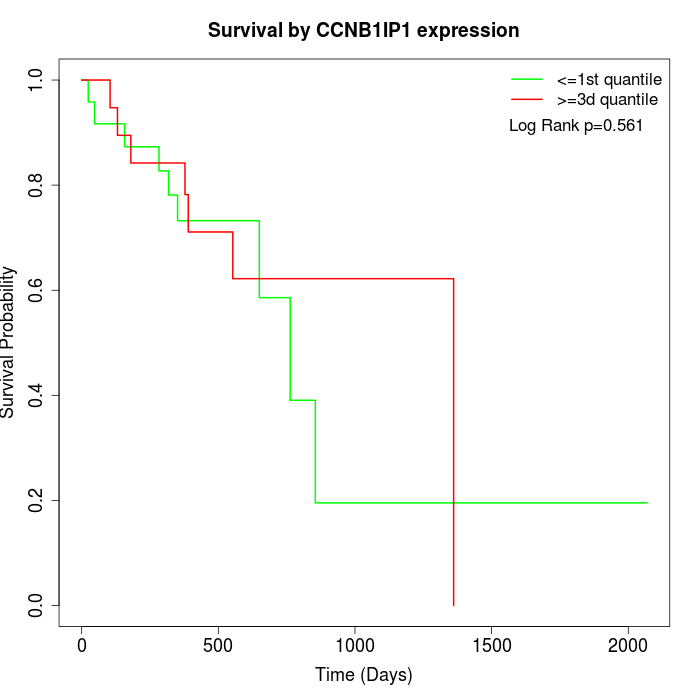 |
| GSE53622 | GSE53624 | TCGA |
Note: Click image to view full size file.
Copy number change of CCNB1IP1:
| Dataset | Gene | EntrezID | Gain | Loss | Normal | Detail |
|---|---|---|---|---|---|---|
| GSE15526 | CCNB1IP1 | 57820 | 11 | 3 | 16 | |
| GSE20123 | CCNB1IP1 | 57820 | 9 | 3 | 18 | |
| GSE43470 | CCNB1IP1 | 57820 | 7 | 1 | 35 | |
| GSE46452 | CCNB1IP1 | 57820 | 19 | 2 | 38 | |
| GSE47630 | CCNB1IP1 | 57820 | 10 | 10 | 20 | |
| GSE54993 | CCNB1IP1 | 57820 | 3 | 11 | 56 | |
| GSE54994 | CCNB1IP1 | 57820 | 18 | 5 | 30 | |
| GSE60625 | CCNB1IP1 | 57820 | 0 | 2 | 9 | |
| GSE74703 | CCNB1IP1 | 57820 | 6 | 1 | 29 | |
| GSE74704 | CCNB1IP1 | 57820 | 4 | 2 | 14 | |
| TCGA | CCNB1IP1 | 57820 | 28 | 16 | 52 |
Total number of gains: 115; Total number of losses: 56; Total Number of normals: 317.
Somatic mutations of CCNB1IP1:
Generating mutation plots.
Highly correlated genes for CCNB1IP1:
Showing top 20/1033 corelated genes with mean PCC>0.5.
| Gene1 | Gene2 | Mean PCC | Num. Datasets | Num. PCC<0 | Num. PCC>0.5 |
|---|---|---|---|---|---|
| CCNB1IP1 | PCNP | 0.755968 | 3 | 0 | 3 |
| CCNB1IP1 | SEC22C | 0.755478 | 4 | 0 | 4 |
| CCNB1IP1 | LCAT | 0.753717 | 3 | 0 | 3 |
| CCNB1IP1 | APEX1 | 0.733981 | 13 | 0 | 10 |
| CCNB1IP1 | ZFP90 | 0.721088 | 4 | 0 | 4 |
| CCNB1IP1 | BCCIP | 0.719651 | 6 | 0 | 6 |
| CCNB1IP1 | DHRSX | 0.717687 | 3 | 0 | 3 |
| CCNB1IP1 | NIPA1 | 0.717624 | 4 | 0 | 3 |
| CCNB1IP1 | PARP2 | 0.712342 | 13 | 0 | 11 |
| CCNB1IP1 | TLR2 | 0.711943 | 3 | 0 | 3 |
| CCNB1IP1 | CD44 | 0.710662 | 3 | 0 | 3 |
| CCNB1IP1 | OCIAD1 | 0.70634 | 3 | 0 | 3 |
| CCNB1IP1 | SUPT16H | 0.705997 | 13 | 0 | 11 |
| CCNB1IP1 | NGDN | 0.70584 | 12 | 0 | 12 |
| CCNB1IP1 | ADSL | 0.703643 | 10 | 0 | 10 |
| CCNB1IP1 | WDR81 | 0.702053 | 4 | 0 | 4 |
| CCNB1IP1 | THOC5 | 0.701629 | 10 | 0 | 9 |
| CCNB1IP1 | CDCA2 | 0.701518 | 3 | 0 | 3 |
| CCNB1IP1 | PSMG3 | 0.701463 | 4 | 0 | 4 |
| CCNB1IP1 | SLC35B2 | 0.700868 | 3 | 0 | 3 |
For details and further investigation, click here