| Full name: pescadillo ribosomal biogenesis factor 1 | Alias Symbol: PES|NOP7 | ||
| Type: protein-coding gene | Cytoband: 22q12.2 | ||
| Entrez ID: 23481 | HGNC ID: HGNC:8848 | Ensembl Gene: ENSG00000100029 | OMIM ID: 605819 |
Expression of PES1:
| Dataset | Gene | EntrezID | Probe | Log2FC | Adj.pValue | Expression |
|---|---|---|---|---|---|---|
| GSE17351 | PES1 | 23481 | 202212_at | 0.5330 | 0.0501 | |
| GSE20347 | PES1 | 23481 | 202212_at | 0.4860 | 0.0008 | |
| GSE23400 | PES1 | 23481 | 202212_at | 0.4155 | 0.0000 | |
| GSE26886 | PES1 | 23481 | 202212_at | 0.7966 | 0.0001 | |
| GSE29001 | PES1 | 23481 | 202212_at | 0.3942 | 0.0255 | |
| GSE38129 | PES1 | 23481 | 202212_at | 0.5215 | 0.0000 | |
| GSE45670 | PES1 | 23481 | 202212_at | 0.5521 | 0.0008 | |
| GSE53622 | PES1 | 23481 | 136106 | 0.5314 | 0.0000 | |
| GSE53624 | PES1 | 23481 | 136106 | 0.7751 | 0.0000 | |
| GSE63941 | PES1 | 23481 | 202212_at | 0.9101 | 0.0023 | |
| GSE77861 | PES1 | 23481 | 202212_at | 0.5025 | 0.0058 | |
| GSE97050 | PES1 | 23481 | A_23_P132260 | 0.3708 | 0.2358 | |
| SRP007169 | PES1 | 23481 | RNAseq | 2.1040 | 0.0000 | |
| SRP008496 | PES1 | 23481 | RNAseq | 2.3672 | 0.0000 | |
| SRP064894 | PES1 | 23481 | RNAseq | 0.8489 | 0.0003 | |
| SRP133303 | PES1 | 23481 | RNAseq | 0.5316 | 0.0029 | |
| SRP159526 | PES1 | 23481 | RNAseq | 0.7762 | 0.0055 | |
| SRP193095 | PES1 | 23481 | RNAseq | 0.5619 | 0.0000 | |
| SRP219564 | PES1 | 23481 | RNAseq | 0.8523 | 0.0334 | |
| TCGA | PES1 | 23481 | RNAseq | 0.1909 | 0.0001 |
Upregulated datasets: 2; Downregulated datasets: 0.
Survival by PES1 expression:
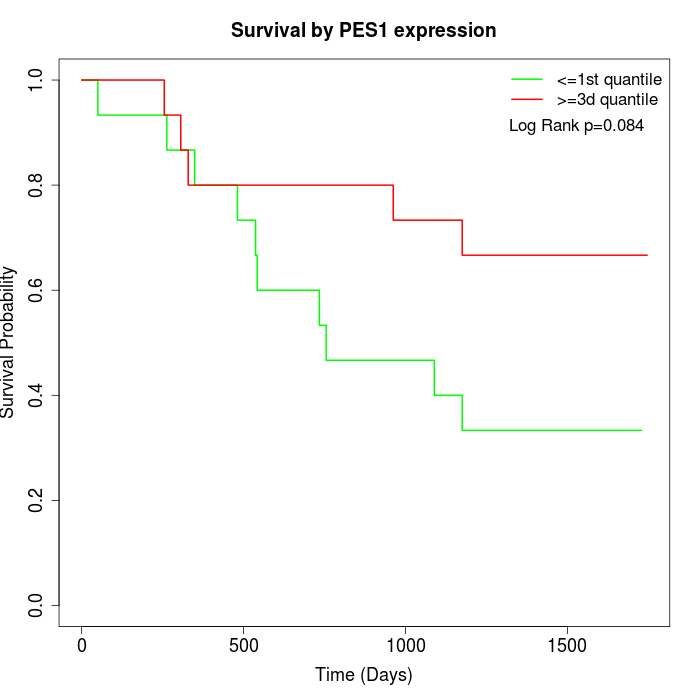 | 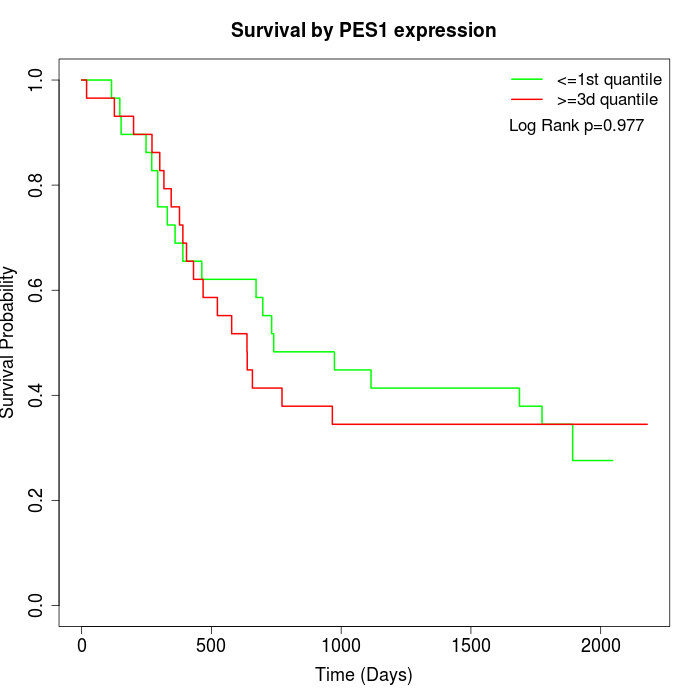 | 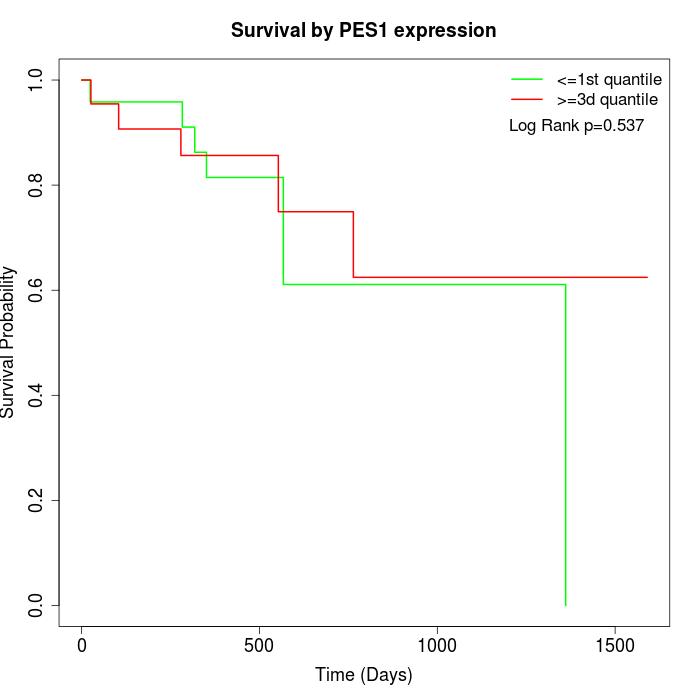 |
| GSE53622 | GSE53624 | TCGA |
Note: Click image to view full size file.
Copy number change of PES1:
| Dataset | Gene | EntrezID | Gain | Loss | Normal | Detail |
|---|---|---|---|---|---|---|
| GSE15526 | PES1 | 23481 | 4 | 5 | 21 | |
| GSE20123 | PES1 | 23481 | 4 | 4 | 22 | |
| GSE43470 | PES1 | 23481 | 4 | 5 | 34 | |
| GSE46452 | PES1 | 23481 | 31 | 1 | 27 | |
| GSE47630 | PES1 | 23481 | 8 | 5 | 27 | |
| GSE54993 | PES1 | 23481 | 3 | 6 | 61 | |
| GSE54994 | PES1 | 23481 | 11 | 8 | 34 | |
| GSE60625 | PES1 | 23481 | 5 | 0 | 6 | |
| GSE74703 | PES1 | 23481 | 4 | 5 | 27 | |
| GSE74704 | PES1 | 23481 | 1 | 1 | 18 | |
| TCGA | PES1 | 23481 | 27 | 15 | 54 |
Total number of gains: 102; Total number of losses: 55; Total Number of normals: 331.
Somatic mutations of PES1:
Generating mutation plots.
Highly correlated genes for PES1:
Showing top 20/1875 corelated genes with mean PCC>0.5.
| Gene1 | Gene2 | Mean PCC | Num. Datasets | Num. PCC<0 | Num. PCC>0.5 |
|---|---|---|---|---|---|
| PES1 | CENPBD1 | 0.786628 | 3 | 0 | 3 |
| PES1 | EFTUD2 | 0.748452 | 8 | 0 | 8 |
| PES1 | CD276 | 0.74338 | 4 | 0 | 4 |
| PES1 | ITM2C | 0.735936 | 4 | 0 | 4 |
| PES1 | BYSL | 0.728465 | 11 | 0 | 11 |
| PES1 | MYBL2 | 0.72617 | 12 | 0 | 12 |
| PES1 | PUF60 | 0.724499 | 11 | 0 | 11 |
| PES1 | UCK2 | 0.722211 | 3 | 0 | 3 |
| PES1 | RUVBL1 | 0.719943 | 12 | 0 | 12 |
| PES1 | EBNA1BP2 | 0.718181 | 3 | 0 | 3 |
| PES1 | SIX4 | 0.717549 | 7 | 0 | 7 |
| PES1 | XPO5 | 0.715391 | 8 | 0 | 8 |
| PES1 | DCAF13 | 0.714291 | 7 | 0 | 6 |
| PES1 | CMSS1 | 0.713418 | 7 | 0 | 7 |
| PES1 | PSMA7 | 0.712745 | 9 | 0 | 9 |
| PES1 | PRMT1 | 0.711265 | 12 | 0 | 11 |
| PES1 | ILF2 | 0.709088 | 11 | 0 | 10 |
| PES1 | UBE2T | 0.70881 | 8 | 0 | 8 |
| PES1 | KIAA0930 | 0.707978 | 10 | 0 | 10 |
| PES1 | TPM3 | 0.707695 | 6 | 0 | 5 |
For details and further investigation, click here