| Full name: carboxylesterase 1 | Alias Symbol: HMSE|CES2|HMSE1|SES1|CEH|CES1A1|CES1A2 | ||
| Type: protein-coding gene | Cytoband: 16q12.2 | ||
| Entrez ID: 1066 | HGNC ID: HGNC:1863 | Ensembl Gene: ENSG00000198848 | OMIM ID: 114835 |
Expression of CES1:
| Dataset | Gene | EntrezID | Probe | Log2FC | Adj.pValue | Expression |
|---|---|---|---|---|---|---|
| GSE17351 | CES1 | 1066 | 209616_s_at | -1.1733 | 0.4589 | |
| GSE20347 | CES1 | 1066 | 209616_s_at | -1.2525 | 0.1370 | |
| GSE23400 | CES1 | 1066 | 209616_s_at | -0.3635 | 0.3175 | |
| GSE26886 | CES1 | 1066 | 209616_s_at | -1.8139 | 0.0151 | |
| GSE29001 | CES1 | 1066 | 209616_s_at | -1.5272 | 0.1022 | |
| GSE38129 | CES1 | 1066 | 209616_s_at | -1.1370 | 0.0638 | |
| GSE45670 | CES1 | 1066 | 209616_s_at | -1.9518 | 0.0493 | |
| GSE53622 | CES1 | 1066 | 13806 | -1.2396 | 0.0000 | |
| GSE53624 | CES1 | 1066 | 13806 | -1.1146 | 0.0000 | |
| GSE63941 | CES1 | 1066 | 209616_s_at | -0.5256 | 0.8364 | |
| GSE77861 | CES1 | 1066 | 209616_s_at | 0.4605 | 0.8002 | |
| GSE97050 | CES1 | 1066 | A_33_P3241269 | -1.4149 | 0.0695 | |
| SRP007169 | CES1 | 1066 | RNAseq | -5.1367 | 0.0000 | |
| SRP008496 | CES1 | 1066 | RNAseq | 0.5239 | 0.7208 | |
| SRP064894 | CES1 | 1066 | RNAseq | -1.3667 | 0.0170 | |
| SRP133303 | CES1 | 1066 | RNAseq | -1.8970 | 0.0008 | |
| SRP193095 | CES1 | 1066 | RNAseq | 1.9147 | 0.0044 | |
| TCGA | CES1 | 1066 | RNAseq | 0.0003 | 0.9995 |
Upregulated datasets: 1; Downregulated datasets: 7.
Survival by CES1 expression:
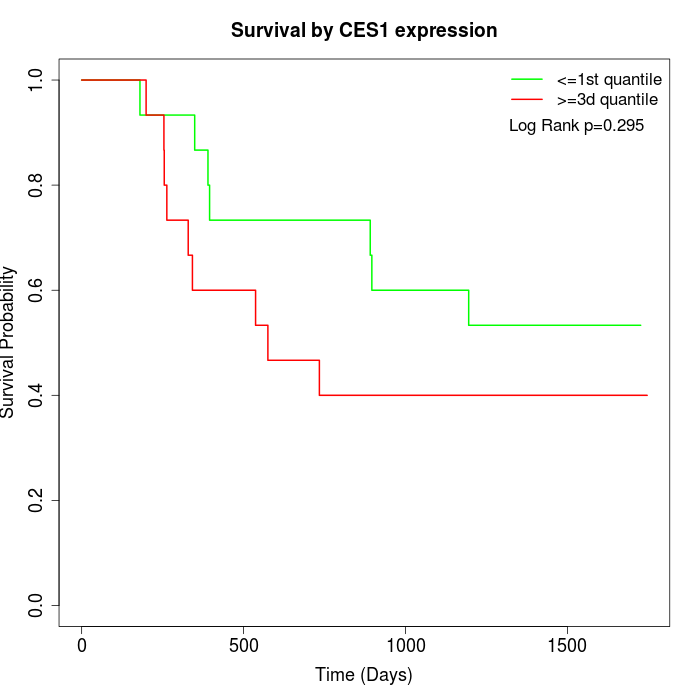 | 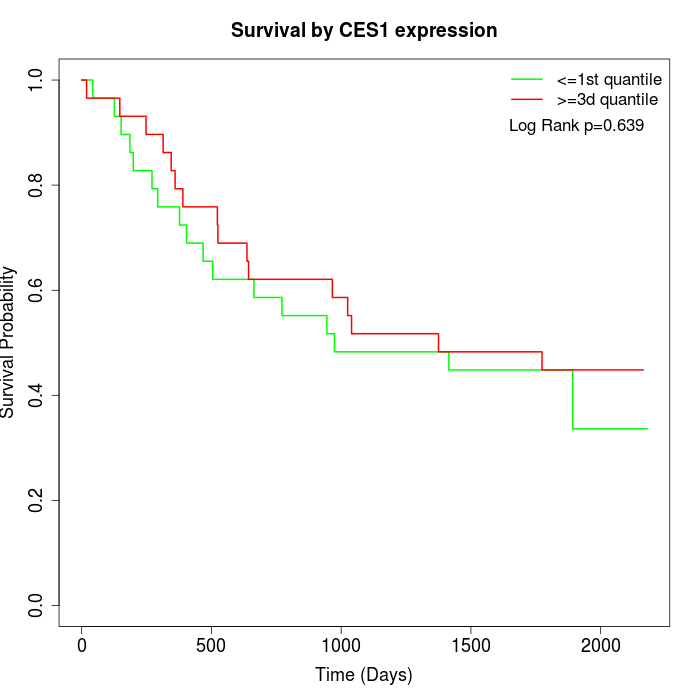 | 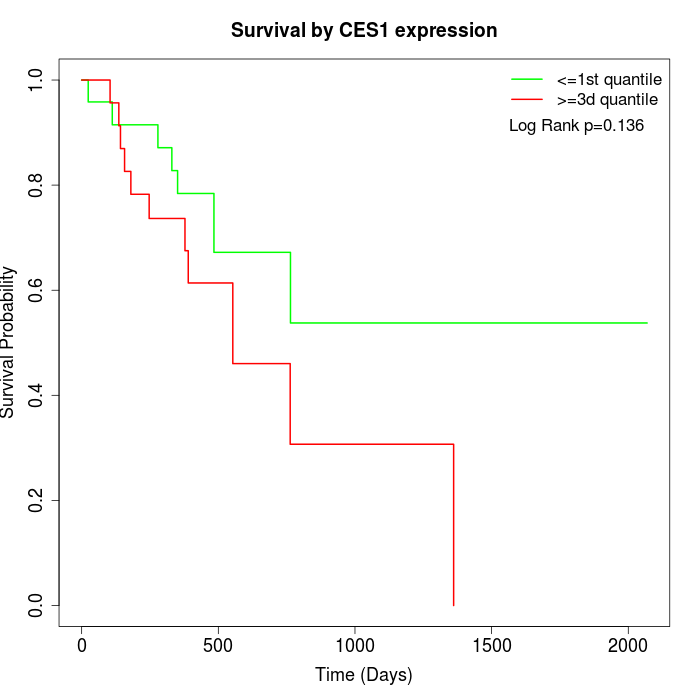 |
| GSE53622 | GSE53624 | TCGA |
Note: Click image to view full size file.
Copy number change of CES1:
| Dataset | Gene | EntrezID | Gain | Loss | Normal | Detail |
|---|---|---|---|---|---|---|
| GSE15526 | CES1 | 1066 | 4 | 0 | 26 | |
| GSE20123 | CES1 | 1066 | 4 | 0 | 26 | |
| GSE43470 | CES1 | 1066 | 2 | 7 | 34 | |
| GSE46452 | CES1 | 1066 | 38 | 1 | 20 | |
| GSE47630 | CES1 | 1066 | 10 | 8 | 22 | |
| GSE54993 | CES1 | 1066 | 2 | 4 | 64 | |
| GSE54994 | CES1 | 1066 | 7 | 10 | 36 | |
| GSE60625 | CES1 | 1066 | 4 | 0 | 7 | |
| GSE74703 | CES1 | 1066 | 2 | 4 | 30 | |
| GSE74704 | CES1 | 1066 | 3 | 0 | 17 | |
| TCGA | CES1 | 1066 | 25 | 12 | 59 |
Total number of gains: 101; Total number of losses: 46; Total Number of normals: 341.
Somatic mutations of CES1:
Generating mutation plots.
Highly correlated genes for CES1:
Showing top 20/58 corelated genes with mean PCC>0.5.
| Gene1 | Gene2 | Mean PCC | Num. Datasets | Num. PCC<0 | Num. PCC>0.5 |
|---|---|---|---|---|---|
| CES1 | CYP4F3 | 0.654075 | 12 | 0 | 11 |
| CES1 | MICU3 | 0.632953 | 3 | 0 | 3 |
| CES1 | TSPAN7 | 0.623648 | 12 | 0 | 9 |
| CES1 | SQSTM1 | 0.59894 | 5 | 0 | 4 |
| CES1 | PPM1K | 0.590277 | 3 | 0 | 3 |
| CES1 | EPHX1 | 0.587187 | 11 | 0 | 9 |
| CES1 | NQO1 | 0.584763 | 11 | 0 | 9 |
| CES1 | TTC19 | 0.581174 | 4 | 0 | 3 |
| CES1 | SLC7A11 | 0.580105 | 4 | 0 | 4 |
| CES1 | PGD | 0.57867 | 10 | 0 | 10 |
| CES1 | ALDH3A1 | 0.57591 | 13 | 0 | 10 |
| CES1 | FEM1B | 0.573426 | 4 | 0 | 3 |
| CES1 | MEGF9 | 0.564703 | 12 | 0 | 9 |
| CES1 | PCF11 | 0.564247 | 5 | 0 | 3 |
| CES1 | TM4SF1 | 0.557571 | 4 | 0 | 3 |
| CES1 | ABCC3 | 0.552913 | 10 | 0 | 5 |
| CES1 | TALDO1 | 0.550187 | 11 | 0 | 8 |
| CES1 | PTGR1 | 0.548483 | 8 | 0 | 5 |
| CES1 | AKTIP | 0.548252 | 4 | 0 | 3 |
| CES1 | SRXN1 | 0.54565 | 6 | 0 | 3 |
For details and further investigation, click here