| Full name: cornichon family AMPA receptor auxiliary protein 2 | Alias Symbol: MGC50896|Cnil|CNIH-2 | ||
| Type: protein-coding gene | Cytoband: 11q13.2 | ||
| Entrez ID: 254263 | HGNC ID: HGNC:28744 | Ensembl Gene: ENSG00000174871 | OMIM ID: 611288 |
Expression of CNIH2:
| Dataset | Gene | EntrezID | Probe | Log2FC | Adj.pValue | Expression |
|---|---|---|---|---|---|---|
| GSE17351 | CNIH2 | 254263 | 230070_at | 0.0718 | 0.7917 | |
| GSE26886 | CNIH2 | 254263 | 230070_at | 0.3638 | 0.0274 | |
| GSE45670 | CNIH2 | 254263 | 230070_at | 0.0118 | 0.9277 | |
| GSE53622 | CNIH2 | 254263 | 30409 | 0.7133 | 0.0000 | |
| GSE53624 | CNIH2 | 254263 | 30409 | 0.4452 | 0.0000 | |
| GSE63941 | CNIH2 | 254263 | 230070_at | 0.4805 | 0.0115 | |
| GSE77861 | CNIH2 | 254263 | 230070_at | -0.1288 | 0.4742 | |
| GSE97050 | CNIH2 | 254263 | A_24_P203315 | 0.3321 | 0.4468 | |
| SRP133303 | CNIH2 | 254263 | RNAseq | 1.0634 | 0.0095 | |
| SRP159526 | CNIH2 | 254263 | RNAseq | 3.3706 | 0.0000 | |
| SRP219564 | CNIH2 | 254263 | RNAseq | 0.9747 | 0.1128 | |
| TCGA | CNIH2 | 254263 | RNAseq | 0.8495 | 0.0002 |
Upregulated datasets: 2; Downregulated datasets: 0.
Survival by CNIH2 expression:
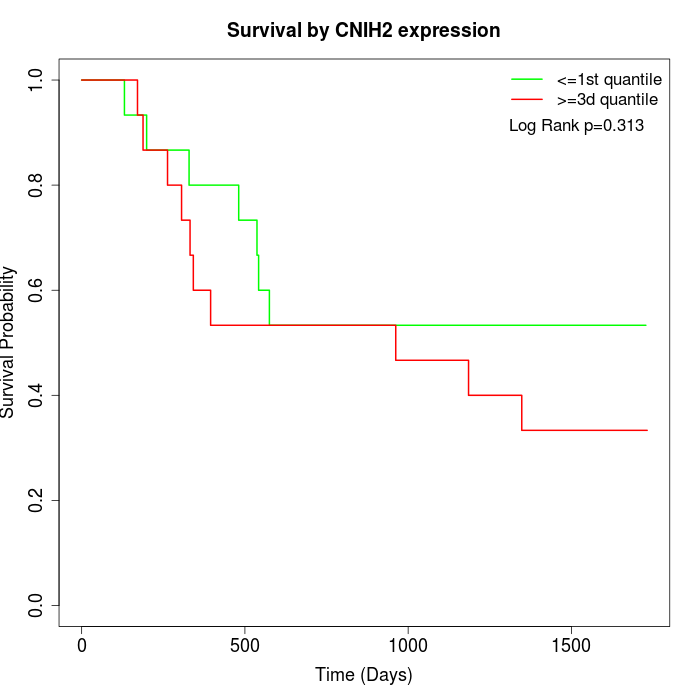 |  | 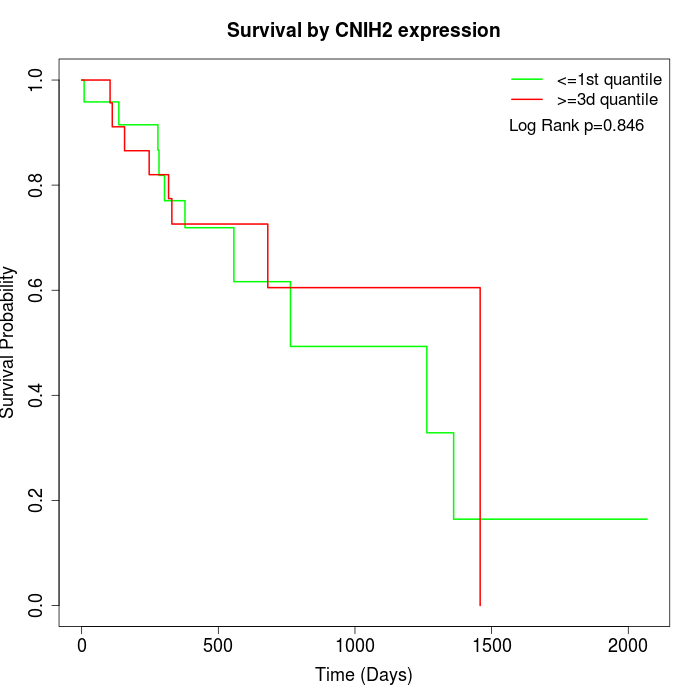 |
| GSE53622 | GSE53624 | TCGA |
Note: Click image to view full size file.
Copy number change of CNIH2:
| Dataset | Gene | EntrezID | Gain | Loss | Normal | Detail |
|---|---|---|---|---|---|---|
| GSE15526 | CNIH2 | 254263 | 9 | 4 | 17 | |
| GSE20123 | CNIH2 | 254263 | 9 | 4 | 17 | |
| GSE43470 | CNIH2 | 254263 | 6 | 1 | 36 | |
| GSE46452 | CNIH2 | 254263 | 11 | 3 | 45 | |
| GSE47630 | CNIH2 | 254263 | 8 | 5 | 27 | |
| GSE54993 | CNIH2 | 254263 | 3 | 0 | 67 | |
| GSE54994 | CNIH2 | 254263 | 8 | 5 | 40 | |
| GSE60625 | CNIH2 | 254263 | 0 | 3 | 8 | |
| GSE74703 | CNIH2 | 254263 | 4 | 0 | 32 | |
| GSE74704 | CNIH2 | 254263 | 7 | 2 | 11 | |
| TCGA | CNIH2 | 254263 | 25 | 6 | 65 |
Total number of gains: 90; Total number of losses: 33; Total Number of normals: 365.
Somatic mutations of CNIH2:
Generating mutation plots.
Highly correlated genes for CNIH2:
Showing top 20/150 corelated genes with mean PCC>0.5.
| Gene1 | Gene2 | Mean PCC | Num. Datasets | Num. PCC<0 | Num. PCC>0.5 |
|---|---|---|---|---|---|
| CNIH2 | HMX1 | 0.725865 | 3 | 0 | 3 |
| CNIH2 | APOC2 | 0.725739 | 3 | 0 | 3 |
| CNIH2 | MLXIPL | 0.705637 | 4 | 0 | 4 |
| CNIH2 | CCDC154 | 0.700873 | 3 | 0 | 3 |
| CNIH2 | GRAP | 0.69067 | 3 | 0 | 3 |
| CNIH2 | ELAVL3 | 0.686166 | 3 | 0 | 3 |
| CNIH2 | ADAM30 | 0.682517 | 4 | 0 | 3 |
| CNIH2 | ACY1 | 0.680077 | 3 | 0 | 3 |
| CNIH2 | CYP2A13 | 0.67741 | 3 | 0 | 3 |
| CNIH2 | CACNA1A | 0.676399 | 4 | 0 | 4 |
| CNIH2 | UNC93B1 | 0.666478 | 4 | 0 | 4 |
| CNIH2 | MEX3D | 0.66567 | 3 | 0 | 3 |
| CNIH2 | ELMOD3 | 0.662209 | 3 | 0 | 3 |
| CNIH2 | EGR4 | 0.661781 | 4 | 0 | 4 |
| CNIH2 | TMEM145 | 0.660387 | 3 | 0 | 3 |
| CNIH2 | NGB | 0.658241 | 3 | 0 | 3 |
| CNIH2 | B3GNT4 | 0.657537 | 3 | 0 | 3 |
| CNIH2 | PFKFB4 | 0.652496 | 4 | 0 | 4 |
| CNIH2 | DLGAP3 | 0.645 | 6 | 0 | 5 |
| CNIH2 | INSL3 | 0.642693 | 3 | 0 | 3 |
For details and further investigation, click here