| Full name: unc-93 homolog B1, TLR signaling regulator | Alias Symbol: UNC93 | ||
| Type: protein-coding gene | Cytoband: 11q13.2 | ||
| Entrez ID: 81622 | HGNC ID: HGNC:13481 | Ensembl Gene: ENSG00000110057 | OMIM ID: 608204 |
Expression of UNC93B1:
| Dataset | Gene | EntrezID | Probe | Log2FC | Adj.pValue | Expression |
|---|---|---|---|---|---|---|
| GSE17351 | UNC93B1 | 81622 | 220998_s_at | 0.2280 | 0.5452 | |
| GSE20347 | UNC93B1 | 81622 | 220998_s_at | 0.1631 | 0.2284 | |
| GSE23400 | UNC93B1 | 81622 | 220998_s_at | -0.0857 | 0.0572 | |
| GSE26886 | UNC93B1 | 81622 | 220998_s_at | 0.3770 | 0.0301 | |
| GSE29001 | UNC93B1 | 81622 | 220998_s_at | -0.2818 | 0.1274 | |
| GSE38129 | UNC93B1 | 81622 | 220998_s_at | 0.1644 | 0.1893 | |
| GSE45670 | UNC93B1 | 81622 | 220998_s_at | 0.0405 | 0.7435 | |
| GSE53622 | UNC93B1 | 81622 | 134360 | 0.2676 | 0.0008 | |
| GSE53624 | UNC93B1 | 81622 | 132642 | 0.3295 | 0.0007 | |
| GSE63941 | UNC93B1 | 81622 | 225869_s_at | 2.1669 | 0.0022 | |
| GSE77861 | UNC93B1 | 81622 | 220998_s_at | 0.0504 | 0.8781 | |
| GSE97050 | UNC93B1 | A_21_P0012568 | 0.7523 | 0.1406 | ||
| SRP007169 | UNC93B1 | 81622 | RNAseq | -0.2282 | 0.6717 | |
| SRP008496 | UNC93B1 | 81622 | RNAseq | -0.0404 | 0.9131 | |
| SRP064894 | UNC93B1 | 81622 | RNAseq | 0.7265 | 0.0020 | |
| SRP133303 | UNC93B1 | 81622 | RNAseq | 0.4062 | 0.1456 | |
| SRP159526 | UNC93B1 | 81622 | RNAseq | -0.1355 | 0.6360 | |
| SRP193095 | UNC93B1 | 81622 | RNAseq | 0.3892 | 0.0283 | |
| SRP219564 | UNC93B1 | 81622 | RNAseq | 0.6184 | 0.0720 | |
| TCGA | UNC93B1 | 81622 | RNAseq | 0.1427 | 0.0473 |
Upregulated datasets: 1; Downregulated datasets: 0.
Survival by UNC93B1 expression:
 | 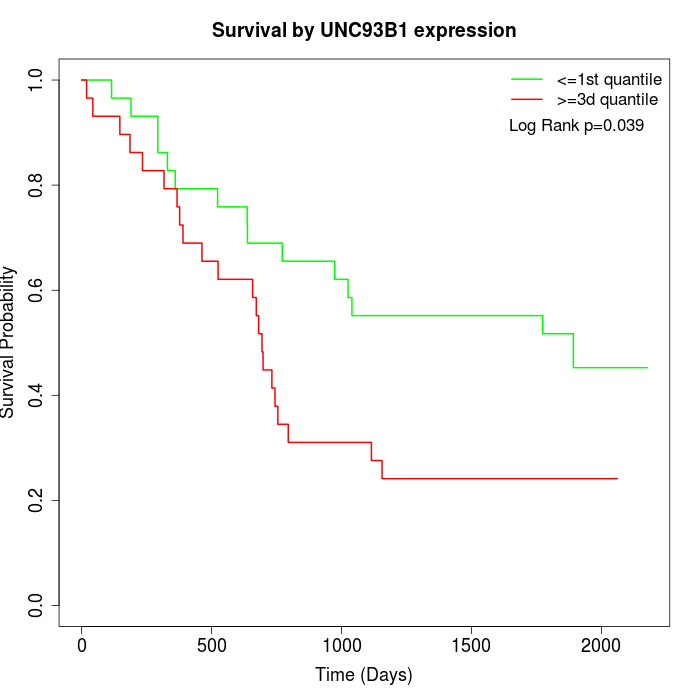 |  |
| GSE53622 | GSE53624 | TCGA |
Note: Click image to view full size file.
Copy number change of UNC93B1:
| Dataset | Gene | EntrezID | Gain | Loss | Normal | Detail |
|---|---|---|---|---|---|---|
| GSE15526 | UNC93B1 | 81622 | 10 | 3 | 17 | |
| GSE20123 | UNC93B1 | 81622 | 10 | 3 | 17 | |
| GSE43470 | UNC93B1 | 81622 | 6 | 3 | 34 | |
| GSE46452 | UNC93B1 | 81622 | 15 | 3 | 41 | |
| GSE47630 | UNC93B1 | 81622 | 10 | 5 | 25 | |
| GSE54993 | UNC93B1 | 81622 | 3 | 2 | 65 | |
| GSE54994 | UNC93B1 | 81622 | 15 | 4 | 34 | |
| GSE60625 | UNC93B1 | 81622 | 0 | 3 | 8 | |
| GSE74703 | UNC93B1 | 81622 | 4 | 2 | 30 | |
| GSE74704 | UNC93B1 | 81622 | 8 | 1 | 11 | |
| TCGA | UNC93B1 | 81622 | 36 | 9 | 51 |
Total number of gains: 117; Total number of losses: 38; Total Number of normals: 333.
Somatic mutations of UNC93B1:
Generating mutation plots.
Highly correlated genes for UNC93B1:
Showing top 20/376 corelated genes with mean PCC>0.5.
| Gene1 | Gene2 | Mean PCC | Num. Datasets | Num. PCC<0 | Num. PCC>0.5 |
|---|---|---|---|---|---|
| UNC93B1 | LZTS1 | 0.710077 | 3 | 0 | 3 |
| UNC93B1 | F11R | 0.69777 | 5 | 0 | 4 |
| UNC93B1 | CDK2AP2 | 0.68013 | 5 | 0 | 4 |
| UNC93B1 | TMEM102 | 0.670888 | 5 | 0 | 5 |
| UNC93B1 | DUS1L | 0.667471 | 6 | 0 | 4 |
| UNC93B1 | CNIH2 | 0.666478 | 4 | 0 | 4 |
| UNC93B1 | FAM189B | 0.659741 | 3 | 0 | 3 |
| UNC93B1 | MTFP1 | 0.657541 | 4 | 0 | 3 |
| UNC93B1 | FERMT3 | 0.65522 | 4 | 0 | 3 |
| UNC93B1 | WDR53 | 0.651541 | 3 | 0 | 3 |
| UNC93B1 | ANO9 | 0.650525 | 4 | 0 | 3 |
| UNC93B1 | WNT8B | 0.649485 | 3 | 0 | 3 |
| UNC93B1 | ZFAT | 0.649186 | 4 | 0 | 4 |
| UNC93B1 | APOA4 | 0.647073 | 3 | 0 | 3 |
| UNC93B1 | KDF1 | 0.644971 | 5 | 0 | 4 |
| UNC93B1 | TRPV5 | 0.639847 | 4 | 0 | 3 |
| UNC93B1 | MFSD12 | 0.638783 | 4 | 0 | 4 |
| UNC93B1 | NRF1 | 0.636127 | 3 | 0 | 3 |
| UNC93B1 | SYT17 | 0.634994 | 3 | 0 | 3 |
| UNC93B1 | HECW1 | 0.631979 | 4 | 0 | 4 |
For details and further investigation, click here